Hi Mike, it could be refered to ‘whole food’ or whole form
- “coffee beans wf” would refer to whole, unprocessed coffee beans.
- “rice-grains-wf” would refer to whole rice grains, retaining the bran and germ.
Hi Mike, it could be refered to ‘whole food’ or whole form
Thank you @adamschroeder for explaining graph_objs, makes sense. And thanks to @Avacsiglo21 and @marieanne for chiming in on the wf question.
The way all of you quickly answered these curiosities is a textbook example how friendly and supportive people are in this forum.
Thank you adamschroeder!
@Mike_Purtell I just saw your question, after I accidentally created my chart with import ploty.gaph_objs as go, I was only able to upload it to PyCafe with this version.
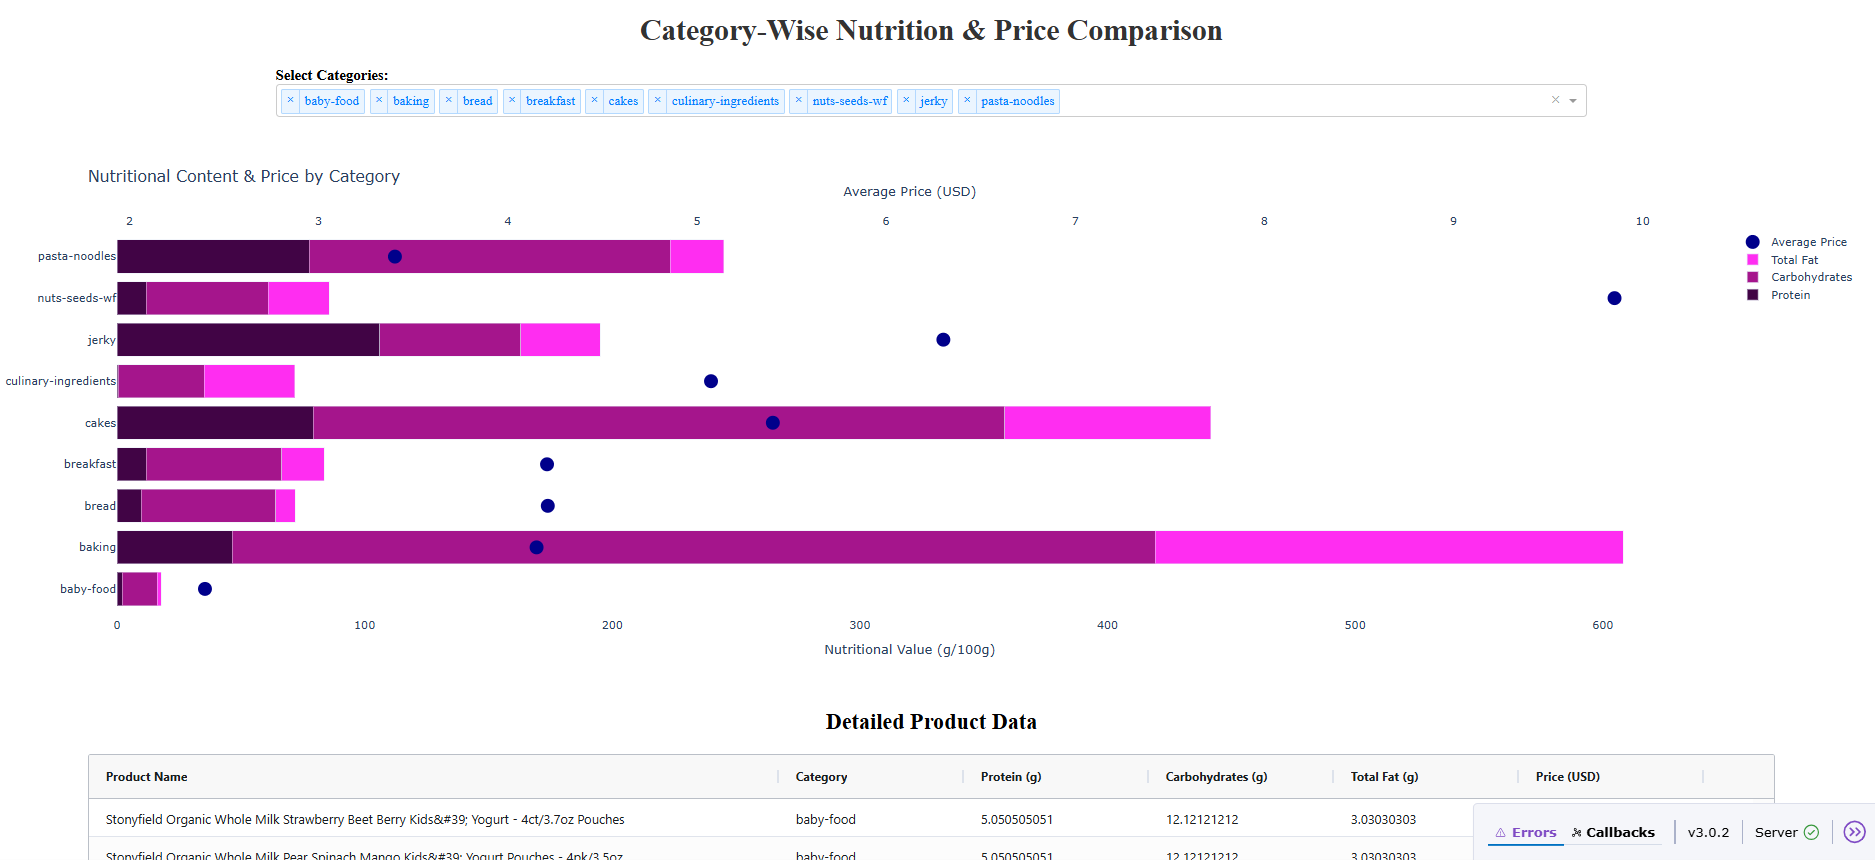
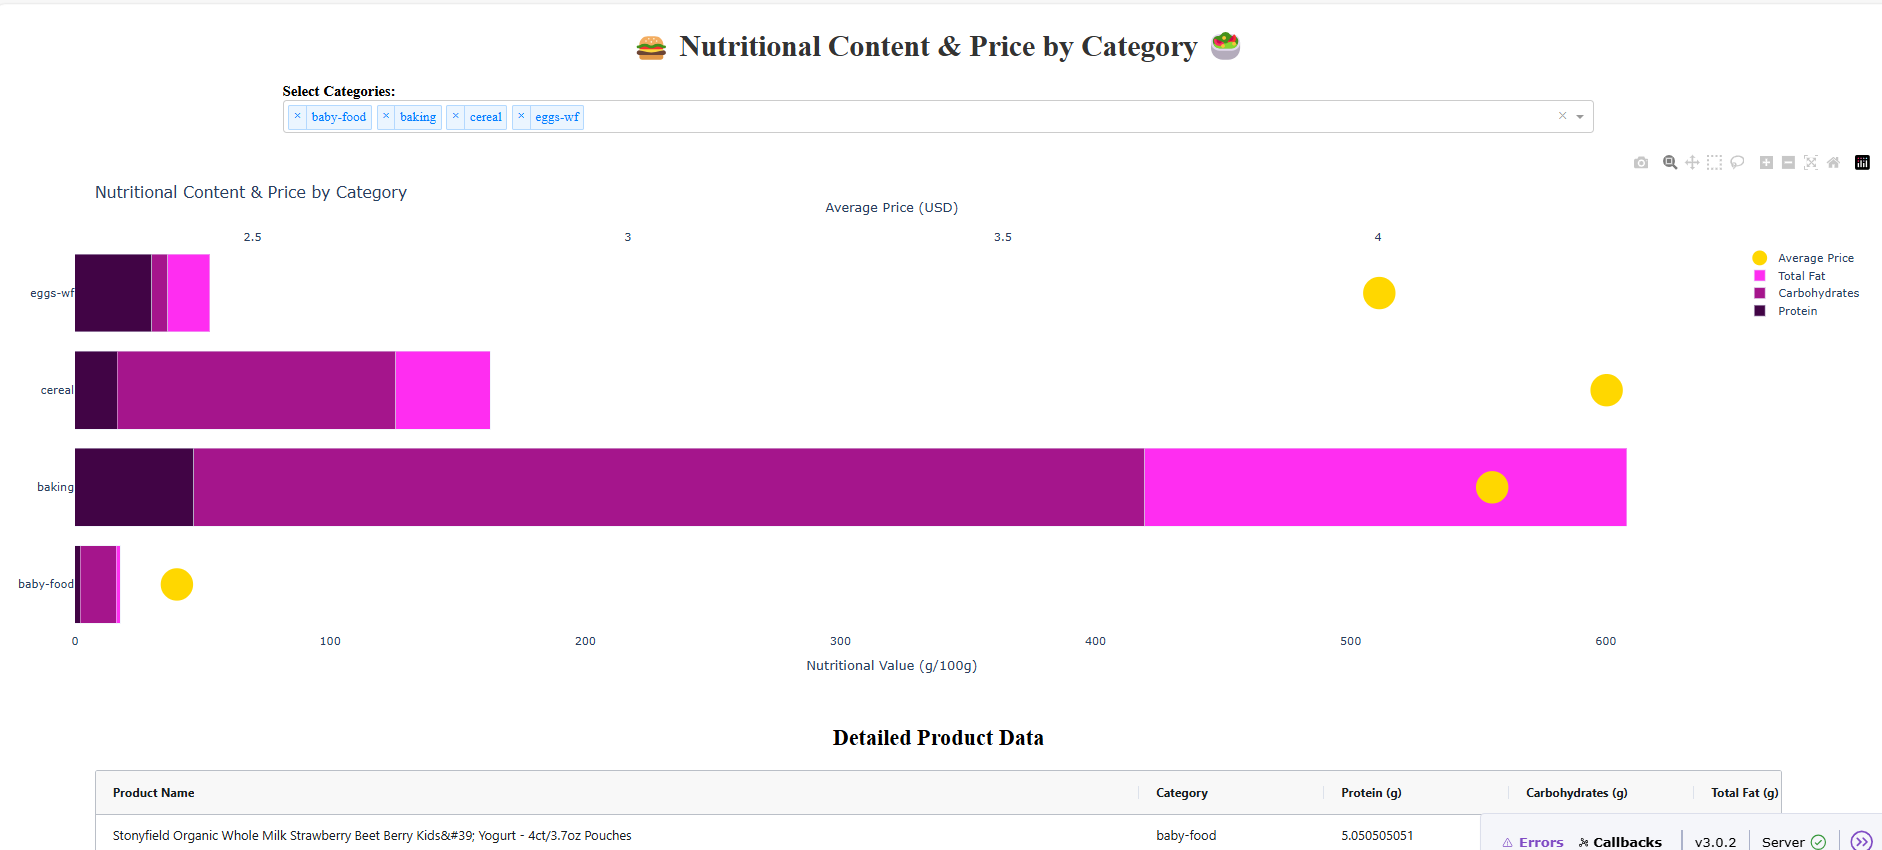
@Ester I love how you created two X axes to your graph, with a bar trace and a scatter trace: pretty advanced stuff ![]()
I chose the colors from colorhunt.co in the food category and the yellow marker symbolizes money. ![]()
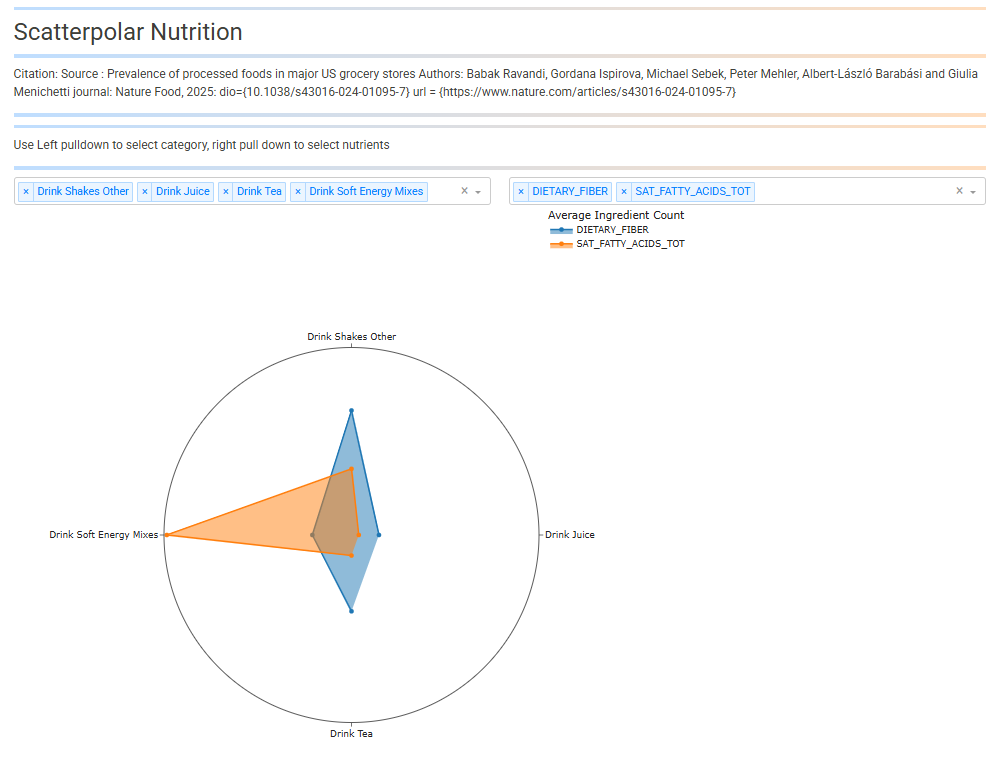
For week 13 I created a single-plot dashboard of the scatter polar example provide with this week’s dataset. Steps taken were:
• Converted the pandas code to polars
• Set all column names to upper case and reworded some of the column labels for brevity
• Changed all categories to title case, removed all dashes
• Used ‘simple_white’ template
• Added 2 pull-down driven callbacks, 1 to select categories and 1 to select nutrient columns
• Removed the table, only visualization is the scatter polar
• I tried to post this on PyCafe, my account is not properly setup. I will work on that.
Here is the code:
from dash import Dash, dcc, html, Input, Output
import dash_bootstrap_components as dbc
import polars as pl
import plotly.graph_objects as go
# Download CSV sheet at:
# https://drive.google.com/file/d/1EoFTpSJOIYmVzemoMLj7vMTqeM1zMy0o/view?usp=sharing

citation = (
   'Source   : Prevalence of processed foods in major US grocery stores ' +
   'Authors: Babak Ravandi, Gordana Ispirova, Michael Sebek, Peter Mehler, ' +
    'Albert-László Barabási and Giulia Menichetti ' +
    'journal: Nature Food, 2025: dio={10.1038/s43016-024-01095-7} ' +
    'url = {https://www.nature.com/articles/s43016-024-01095-7}'
)
style_space = {
    'border': 'none',
    'height': '5px',
    'background': 'linear-gradient(to right, #007bff, #ff7b00)',
    'margin': '10px 0'
    }
df=pl.read_csv('GroceryDB_foods.csv')
df_filtered = (
    df
    .rename({col: col.upper() for col in df.columns})
    .with_columns(
       CATEGORY=pl.col('HARMONIZED SINGLE CATEGORY')
        .str.to_titlecase()
        .str.replace_all('-', ' ')
        .str.replace('Milk Milk Substitute', 'Milk or Substitute'),
      FAT_TOTAL=pl.col('TOTAL FAT'),
      CARBS=pl.col('CARBOHYDRATE'),
      SUGAR_TOTAL=pl.col('SUGARS, TOTAL'),
      DIETARY_FIBER=pl.col('FIBER, TOTAL DIETARY'),
      SAT_FATTY_ACIDS_TOT=pl.col('FATTY ACIDS, TOTAL SATURATED'),
      VITAMIN_A=pl.col('TOTAL VITAMIN A'),
      VITAMIN_C=pl.col('VITAMIN C'),
    )
    .select(
      'CATEGORY', 'CALCIUM', 'CARBS',  'CHOLESTEROL', 'DIETARY_FIBER',
      'FAT_TOTAL', 'IRON', 'PROTEIN', 'SAT_FATTY_ACIDS_TOT', 'SODIUM',
      'SUGAR_TOTAL', 'VITAMIN_A', 'VITAMIN_C'
    )
    .group_by('CATEGORY', maintain_order=True)
    .mean()
)
# these lists will be used as callback choices
category_list = sorted(df_filtered['CATEGORY'].unique().to_list())
category_defaults = [
    'Drink Shakes Other', 'Drink Juice', 'Drink Tea', 'Drink Soft Energy Mixes']
nutrition_list = sorted([c for c in df_filtered.columns if c!= 'CATEGORY'])
nutrient_defaults = ['DIETARY_FIBER', 'SAT_FATTY_ACIDS_TOT']

#----- DEFINE FUNCTIONS---------------------------------------------------------
def make_fig(df_filtered, selected_cats, selected_nutrients):
    df_selected = (
        df_filtered
        .filter(pl.col('CATEGORY').is_in(selected_cats))
        .select(['CATEGORY'] + selected_nutrients)
    )
    fig = go.Figure()
    for nutrient in selected_nutrients:
        fig.add_trace(go.Scatterpolar(
            r=df_selected[nutrient],
            theta=df_selected['CATEGORY'],
            fill='toself',
            name=nutrient,
        ))
    fig.update_layout(
        template='simple_white',
        polar=dict(
            radialaxis=dict(
            visible=False,
            showticklabels = False,
            )),
        showlegend=True,
            legend=dict(
                title=dict(
                    text="Average Ingredient Count"
                )
        ),
        margin=dict(l=200, r=20, t=0, b=20),
        height=900, width=900,
    )
    return fig

app = Dash(external_stylesheets=[dbc.themes.SANDSTONE])
app.layout = dbc.Container([
    html.Hr(style=style_space),
    html.H2(
        'Scatterpolar Nutrition',
        style={
            'text-align': 'left'
        }
    ),
    html.Hr(style=style_space),
    html.Div([
        html.P(
            f'Citation: {citation}',
            ),
        html.Hr(style=style_space)
    ]),
    html.Hr(style=style_space),
    html.Div([
        html.P(
            f'Use Left pulldown to select category, right pull down to select nutrients',
            ),
        html.Hr(style=style_space)
    ]),
    dbc.Row([
        dbc.Col(
        [dcc.Dropdown(
            category_list,
            category_defaults,
            id='cat_dropdown',
            multi=True,
            ),
        ]),
        dbc.Col([dcc.Dropdown(
            nutrition_list,
            nutrient_defaults,
            id='nutrient_dropdown',
            multi=True,
        ),]),
    ]),

    html.Div(id='dd-output-container2'),

    dbc.Row(
        [
            dbc.Col(
                dcc.Graph(
                    id='scatterpolar_fig',
                    style={
                        'width': '75vh',
                        'height': '75vh',
                    },
                ),
            ),
        ]
    )
])

@app.callback(
        Output('scatterpolar_fig', 'figure'),
        Input('cat_dropdown', 'value'),
        Input('nutrient_dropdown', 'value'),
)
def update_dashboard(selected_cats, selected_nutrients):
    # call back returns string if 1 item is selected, list if multiple items
    # are selected. The make_fig requires lists, next 4 lines take care of this
    if not type(selected_cats) is list:
        selected_cats = [selected_cats]
    if not type(selected_nutrients) is list:
        selected_nutrients = [selected_nutrients]
    scatter_polar = make_fig(df_filtered, selected_cats, selected_nutrients)
    return scatter_polar

#----- RUN THE APP -------------------------------------------------------------
if __name__ == "__main__":
    app.run(debug=True)
Hi Alex, this is brilliant work. I have downloaded your code, and it ran seamlessly on my system. If my dashboards can ever be as attractive and useful as what you have done, I would be so happy. Based on your work I am looking online at the differences between cosine similarity and Pearson regression which I use from time to time. Fascinating stuff. Have a great weekend.
Wow Mike, I’m grateful for your words, they mean a lot. I get help from AI and many hours of trial and error for the dashboards, and obviously the community feedback is the most valuable thing. We’re on the same page, I love looking for relationships/patterns. I find the scikit-learn library spectacular, and these work sections allow me to find ways to implement those fascinating tools. Of course, sometimes it’s difficult to find something, but I make the attempt. Happy weekend to you too.
![]()
![]()