Hello Figure Friday Community:
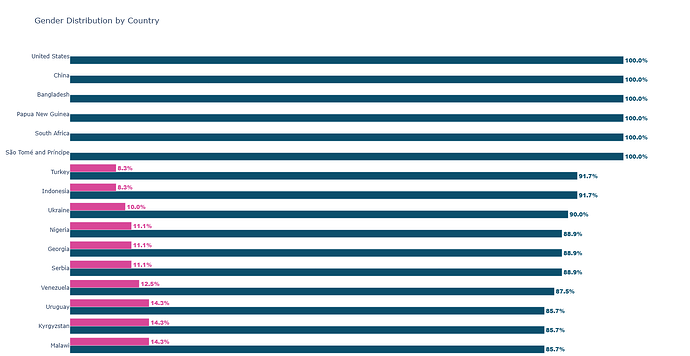
This week’s Figure Friday project is an interactive dashboard for exploring historical banknote character data. Key features include: interactive visualizations of gender distribution and historical trends, detailed character information via modals, a statistical summary, and dynamic controls like a year range slider and reset button.
Dashboard
The code
import dash
from dash import dcc, html, Input, Output, State
import dash_bootstrap_components as dbc
import pandas as pd
import plotly.express as px
import plotly.graph_objs as go
import numpy as np
from dash.exceptions import PreventUpdate

# Load the data globally
df = pd.read_csv("banknotesData.csv")

# Preprocessing
df['gender'] = df['gender'].map({'F': 'Female', 'M': 'Male'})
df['firstAppearanceDate'] = pd.to_numeric(df['firstAppearanceDate'], errors='coerce')

# Convert numpy types to native Python types
min_year = int(df['firstAppearanceDate'].min())
max_year = int(df['firstAppearanceDate'].max())

# Color palette
color_palette = {
    'Male': '#3498db',   # light blue
    'Female': '#e74c3c',  # Soft red
    'Grid': 'rgba(0,0,0,0.05)',
    'Background': '#f4f6f7', # gray
    'Header': '#34495e'   # Dark blue-gray
}

# Initialize the Dash app
app = dash.Dash(__name__,
                external_stylesheets=[dbc.themes.FLATLY],
                suppress_callback_exceptions=True,
                meta_tags=[{'name': 'viewport', 'content': 'width=device-width, initial-scale=1'}])
app.title = "Banknote Characters Explorer"

# App Layout
app.layout = dbc.Container([
    # Modal for character details
    dbc.Modal(
        [
            dbc.ModalHeader(
                dbc.ModalTitle("Character Details", className='text-white fw-bold'),
                close_button=True,
                style={'backgroundColor': color_palette['Header']}
            ),
            dbc.ModalBody(id='character-details-modal-body'),
        ],
        id="character-details-modal",
        size="xl",
        scrollable=True,
        style={'backgroundColor': 'rgba(244, 246, 247,0.95)'}
    ),

    # Header
    dbc.Row([
        dbc.Col(html.H1("BillNoteTimeline: Banknote Character Explorer",
                        className='text-center my-4 text-primary'),
                width=12)
    ]),

    # Main content row
    dbc.Row([
        # Gender Distribution Column
        dbc.Col([
            html.H4("Gender Distribution", className='text-center'),
            html.Hr(style={'backgroundColor': color_palette['Background'], 'height': '10px' }),
            dcc.Graph(id='gender-pie-chart', config={'displayModeBar': False})
        ], width=3),

        # Timeline Column
        dbc.Col([
            html.H4("Historical Timeline", className='text-center'),
            dcc.RangeSlider(
                id='year-range-slider',
                min=min_year,
                max=max_year,
                step=20,
                marks={
                    str(min_year): str(min_year),
                    str(max_year): str(max_year),
                    **{str(year): str(year) for year in range(min_year + 20, max_year, 20)}
                },
                value=[min_year, max_year],
                tooltip={'placement': 'bottom', 'always_visible': False}
            ),
            dbc.Button("Reset", id="reset-button", className="mt-2"),
            dcc.Graph(id='timeline-visualization')
        ], width=9)
    ]),
    dbc.Row([
        dbc.Col([
            html.P('🔍 Click on the circle/square to learn more about the characters from that year',
                   className='text-center text-muted fw-bold'
    )
])
], className='mt-3'),

    # Additional Information
    dbc.Row([
        dbc.Col(html.Div(id='stats-summary', className='mt-4 text-center'), width=12)
    ])
], fluid=True, style={'backgroundColor': color_palette['Background']})

# Gender Pie Chart Callback
@app.callback(
    Output('gender-pie-chart', 'figure'),
    [Input('year-range-slider', 'value')]
)
def update_gender_pie_chart(year_range):
    filtered_df = df[
        (df['firstAppearanceDate'] >= year_range[0]) &
        (df['firstAppearanceDate'] <= year_range[1])
    ]

    gender_counts = filtered_df['gender'].value_counts()

    fig = px.pie(
        values=gender_counts.values,
        names=gender_counts.index,
        hole=0.6,
        title=f'Years ({year_range[0]}-{year_range[1]})',
        color_discrete_map={'Male': color_palette['Male'], 'Female': color_palette['Female']},
        template='simple_white'
    )
    fig.update_layout(showlegend=False,paper_bgcolor='rgb(244, 246, 247)', plot_bgcolor='rgb(244, 246, 247)')

    fig.update_traces(
        textposition='inside',
        textinfo='percent+label',
        marker=dict(line=dict(color='#ffffff', width=1.5))
    )

    return fig

# Timeline Visualization Callback
@app.callback(
    Output('timeline-visualization', 'figure'),
    [Input('year-range-slider', 'value')]
)
def update_timeline(year_range):
    filtered_df = df[
        (df['firstAppearanceDate'] >= year_range[0]) &
        (df['firstAppearanceDate'] <= year_range[1])
    ]

    year_counts = filtered_df.groupby(['firstAppearanceDate', 'gender']).size().reset_index(name='count')

    fig = px.scatter(
        year_counts,
        x='firstAppearanceDate',
        y='count',
        color='gender',
        symbol='gender',
        symbol_sequence=['circle', 'square'],
        size='count',
        template='ygridoff',
        color_discrete_map={'Male': color_palette['Male'], 'Female': color_palette['Female']},
        title=f'Timeline of Characters ({year_range[0]}-{year_range[1]})',
        labels={'firstAppearanceDate': 'Year', 'count': 'Character Count', 'gender': 'Gender'}
    )

    fig.update_layout(
        xaxis=dict(title='Year', gridcolor=color_palette['Grid']),
        yaxis=dict(title='Character Count', gridcolor=color_palette['Grid']),
        legend=dict(orientation="h", yanchor="bottom", y=1.02, xanchor="center", x=0.5),
        hovermode='closest',
        paper_bgcolor='rgb(244, 246, 247)', plot_bgcolor='rgb(244, 246, 247)'
    )

    return fig

# Reset Slider Callback
@app.callback(
    Output('year-range-slider', 'value'),
    Input('reset-button', 'n_clicks'),
    prevent_initial_call=True
)
def reset_slider(n_clicks):
    if n_clicks:
        return [min_year, max_year]
    else:
        raise PreventUpdate

@app.callback(
    [Output('character-details-modal', 'is_open'),
     Output('character-details-modal-body', 'children')],
    [Input('timeline-visualization', 'clickData')],
    [State('year-range-slider', 'value'),
     State('character-details-modal', 'is_open')]
)
def toggle_modal(clickData, year_range, is_open):
    if not clickData:
        return False, []

    # Get the clicked year and gender
    year = clickData['points'][0]['x']
    gender = clickData['points'][0]['curveNumber']  # 0 for Male, 1 for Female
    gender_map = {0: 'Male', 1: 'Female'}
    selected_gender = gender_map[gender]

    # Filter characters by year range and gender
    year_characters = df[
        (df['firstAppearanceDate'] == year) &
        (df['gender'] == selected_gender) &
        (df['firstAppearanceDate'] >= year_range[0]) &
        (df['firstAppearanceDate'] <= year_range[1])
    ]

    character_cards = [
        dbc.Card([
            dbc.CardHeader(
                html.H5(char['name'], className='text-white m-0'),
                className='bg-primary text-center'
            ),
            dbc.CardBody([
                html.P(f"🌍 Country: {char['country']}", className='card-text'),
                html.P(f"💼 Profession: {char.get('profession', 'N/A')}", className='card-text'),
                html.P(f"💵 Note: {char.get('currencyName', 'N/A')}", className='card-text'),
                html.P(f"💰 Current Value: {char.get('currentBillValue', 'N/A')}", className='card-text'),
                html.P(f"💬 Comments: {char.get('comments', 'N/A')}", className='card-text')
            ])
        ], className='mb-3 shadow-sm')
        for _, char in year_characters.iterrows()
    ]

    modal_content = [
        html.H4(f"{selected_gender} Characters in {year}", className='text-center mb-4'),
        dbc.Row([dbc.Col(card, width=4) for card in character_cards])
    ]

    return not is_open, modal_content

# Stats Summary Callback
@app.callback(
    Output('stats-summary', 'children'),
    [Input('year-range-slider', 'value')]
)
def update_stats_summary(year_range):
    filtered_df = df[
        (df['firstAppearanceDate'] >= year_range[0]) &
        (df['firstAppearanceDate'] <= year_range[1])
    ]

    total_characters = len(filtered_df)
    countries = filtered_df['country'].nunique()
    most_common_country = filtered_df['country'].mode().values[0]

    summary = dbc.Card(
        dbc.CardBody([
            html.H5("Dashboard Statistics", className='card-title text-primary'),
            html.P(f"Total Characters: {total_characters}", className='card-text'),
            html.P(f"Countries Represented: {countries}", className='card-text'),
            html.P(f"Most Common Country: {most_common_country}", className='card-text')
        ])
    )

    return summary

# Boilerplate for cloud deployment
server = app.server


if __name__ == '__main__':
    app.run_server(debug=True,)
Any comments/suggestion is highly appreciated
Best Regards
![]() If you prefer to collaborate with others on Discord, join the Plotly Discord channel.
If you prefer to collaborate with others on Discord, join the Plotly Discord channel.


