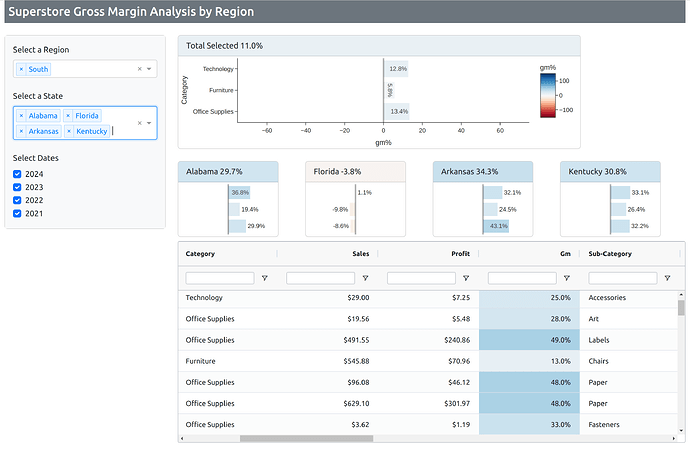
In the original Workout Wednesday challenge, I liked how the figure showed the gross margin percent by state and product category. Inspired by this, I made a Dash app using Dash Bootstrap Components to present similar information. Each state’s data is displayed in a card rather than a single figure with subplots. This responsive design automatically adjusts to various screen sizes.
This dashboard would be useful for a manager monitoring profitability. It makes it easy to benchmark states and product categories within regions. I also added a Dash AG Grid, allowing users to drill down and find details of individual orders driving low or high gross margin results.
See the live app here: PyCafe - Dash - Superstore Gross Margin Analysis
See the code on Github
