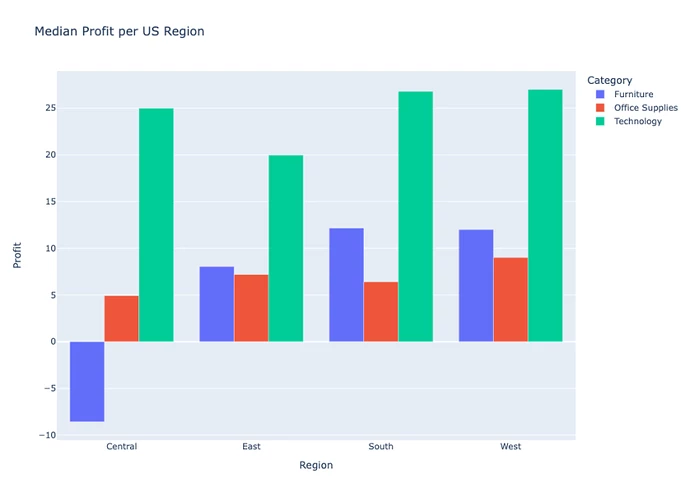
https://dash.geomapindex.com/figure_friday_week_1
Mainly focused on building an interactive map with this project. Created a search for customer names, state and category type. Setup flyto for clicking data in the ag Grid, setup a custom cluster to show category distribution, created 4 geojson’s to show the Regions and setup borders for each state, tooltip for marker data.
Code:
from dash import *
import dash_ag_grid as dag
import dash_leaflet as dl
import pandas as pd
import geopandas as gpd
import dash_mantine_components as dmc
import json
from dash_extensions.javascript import arrow_function, assign
#########################################
# Setup data and format for the map data, borders & cluster
#########################################
# Define the file path for data
file_path = '2024/week-28/Superstore_with_LAT_LNG.xlsx'
# Read the Excel file
df = pd.read_excel(file_path)
# Get unique State/Province values
unique_states = df['State/Province'].unique()
# Create data for Select component
state_select_data = [{"label": "Everything", "value": "Everything"}] + [
{"label": state, "value": state} for state in sorted(unique_states)
]
# Create a dictionary mapping state/province to region
state_to_region = pd.Series(df.Region.values, index=df['State/Province']).to_dict()
# Convert any Timestamp columns to strings
for column in df.select_dtypes(include=['datetime', 'datetime64[ns]']):
df[column] = df[column].astype(str)
# Convert the DataFrame to a GeoDataFrame
gdf = gpd.GeoDataFrame(
df,
geometry=gpd.points_from_xy(df.LNG, df.LAT)
)
# Convert the GeoDataFrame to GeoJSON
features = []
for _, row in df.iterrows():
features.append({
"type": "Feature",
"geometry": {
"type": "Point",
"coordinates": [row["LNG"], row["LAT"]],
},
"properties": {
"tooltip": f"Customer Name: {row['Customer Name']}<br>Segment: {row['Segment']}<br>Country/Region: {row['Country/Region']}<br>City: {row['City']}<br>State/Province: {row['State/Province']}<br>Postal Code: {row['Postal Code']}<br>Region: {row['Region']}<br>Product ID: {row['Product ID']}<br>Category: {row['Category']}<br>Sub-Category: {row['Sub-Category']}<br>Product Name: {row['Product Name']}<br>Sales: {row['Sales']}<br>Quantity: {row['Quantity']}<br>Discount: {row['Discount']}<br>Profit: {row['Profit']}",
"Category": row['Category'],
}
})
geojson_dict = {
"type": "FeatureCollection",
"features": features
}
# Load GeoJSON data setup borders for regions
with open('2024/week-28/path_to_regions_geojson_file.geojson', 'r') as f:
regions_geojson = json.load(f)
# Function to style the GeoJSON features based on the 'Region' property
# Define color mapping for regions
region_colors = {
'East': '#ff0000',
'West': '#00ff00',
'Central': '#0000ff',
'South': '#ffff00',
'Unknown': '#808080' # Grey for unknown regions
}
# Create separate GeoJSON data for each region
region_geojsons = {region: {"type": "FeatureCollection", "features": []} for region in region_colors.keys()}
# Apply the style to each feature in the GeoJSON
for feature in regions_geojson['features']:
state_province = feature['properties']['name']
region = state_to_region.get(state_province, 'Unknown')
feature['properties']['fillColor'] = region_colors.get(region, '#808080')
region_geojsons[region]['features'].append(feature)
# Define color mapping for categories
category_colors = {
'Office Supplies': 'white',
'Technology': 'black',
'Furniture': 'purple',
'Unknown': 'gray' # Color for unknown categories
}
# JavaScript function to create custom clusters
cluster_to_layer = assign(
"""function(feature, latlng, index, context) {
function ringSVG(opt) {
function describeArc(opt) {
const innerStart = polarToCartesian(opt.x, opt.y, opt.radius, opt.endAngle);
const innerEnd = polarToCartesian(opt.x, opt.y, opt.radius, opt.startAngle);
const outerStart = polarToCartesian(opt.x, opt.y, opt.radius + opt.ringThickness, opt.endAngle);
const outerEnd = polarToCartesian(opt.x, opt.y, opt.radius + opt.ringThickness, opt.startAngle);
const largeArcFlag = opt.endAngle - opt.startAngle <= 180 ? "0" : "1";
return [ "M", outerStart.x, outerStart.y,
"A", opt.radius + opt.ringThickness, opt.radius + opt.ringThickness, 0, largeArcFlag, 0, outerEnd.x, outerEnd.y,
"L", innerEnd.x, innerEnd.y,
"A", opt.radius, opt.radius, 0, largeArcFlag, 1, innerStart.x, innerStart.y,
"L", outerStart.x, outerStart.y, "Z"].join(" ");
}
const polarToCartesian = (centerX, centerY, radius, angleInDegrees) => {
return { x: centerX + (radius * Math.cos((angleInDegrees - 90) * Math.PI / 180.0)),
y: centerY + (radius * Math.sin((angleInDegrees - 90) * Math.PI / 180.0)) };
}
opt = opt || {};
const defaults = { width: 60, height: 60, radius: 20, gapDeg: 5, fontSize: 17, text: `test`,
ringThickness: 7, colors: [] };
opt = {...defaults, ...opt};
let startAngle = 90;
let paths = '';
const totalPerc = opt.colors.reduce((acc, val) => acc + val.perc, 0);
for (let i = 0; i < opt.colors.length; i++) {
const segmentPerc = opt.colors[i].perc / totalPerc;
const endAngle = startAngle + (segmentPerc * 360) - opt.gapDeg;
const d = describeArc({ x: opt.width / 2, y: opt.height / 2, radius: opt.radius, ringThickness: opt.ringThickness, startAngle, endAngle });
paths += `<path fill="${opt.colors[i].color}" d="${d}"></path>`;
startAngle = endAngle + opt.gapDeg;
}
return `<svg width="${opt.width}" height="${opt.height}">
${paths}
<text x="50%" y="50%" alignment-baseline="middle" text-anchor="middle" font-size="${opt.fontSize}"
fill="black">${opt.text || opt.goodPerc}
</text>
</svg>`;
}
const leaves = index.getLeaves(feature.properties.cluster_id);
const categories = leaves.map(leaf => leaf.properties.Category);
// Count the occurrences of each category
const category_counts = categories.reduce((acc, category) => {
acc[category] = (acc[category] || 0) + 1;
return acc;
}, {});
// Calculate the percentage for each category
const colors = Object.keys(category_counts).map(category => ({
color: context.hideout.category_colors[category] || 'gray',
perc: category_counts[category]
}));
const scatterIcon = L.DivIcon.extend({
createIcon: function(oldIcon) {
let icon = L.DivIcon.prototype.createIcon.call(this, oldIcon);
return icon;
}
});
const total = feature.properties.point_count_abbreviated;
const icon = new scatterIcon({
html: ringSVG({
text: `${total}`,
colors
}),
className: "marker-cluster",
iconSize: L.point(60, 60)
});
return L.marker(latlng, {icon: icon});
}
"""
)
#########################################
# Setup Layout
#########################################
dont_show = dmc.Stack(
[
dmc.TextInput(
placeholder="Filter Locations...",
style={"width": '95%', "margin-bottom": "9px"},
id="superstore_quick_filter_input",
),
dmc.Group(
[
dmc.Select(
# label='Select a State',
placeholder="Select a State / Provence",
id="superstore_autocomplete_r_map",
value="Everything",
data=state_select_data,
style={
"width": '45%',
"marginBottom": 10,
"color": "red",
},
),
dmc.Select(
placeholder="Category",
id="superstore_location_type",
value="everything",
data=[
{"label": "Everything", "value": "everything"},
{"label": "Office Supplies", "value": "Office Supplies"},
{"label": "Technology", "value": "Technology"},
{"label": "Furniture", "value": "Furniture"},
],
style={
"width": '45%',
"marginBottom": 10,
"color": "red",
},
),
],
grow=False,
position="left",
),
dag.AgGrid(
className="ag-theme-alpine-dark",
id="superstore_quick_filter_simple",
rowData=df.to_dict('records'),
columnDefs=[
{"headerName": i, "field": i, "width": '100%'} for i in df.columns
] + [
{
"headerName": "Profit",
"field": "Profit",
"cellStyle": {
"styleConditions": [
{
"condition": "params.value > 0",
"style": {"backgroundColor": "rgba(0, 255, 0, 0.3)"}
},
{
"condition": "params.value < 0",
"style": {"backgroundColor": "rgba(255, 0, 0, 0.3)"}
},
{
"condition": "params.value == 0",
"style": {"backgroundColor": "rgba(255, 255, 255, 0.3)"}
}
]
},
"width": '100%'
}
],
defaultColDef={"filter": False, "editable": False},
dashGridOptions={
'suppressMenuHide': True,
"rowSelection": "single",
"animateRows": False,
"pagination": False,
},
style={},
),
], style={"display": "none"}
)
# Initialize the Dash app
app = Dash(__name__, external_stylesheets=["https://use.fontawesome.com/releases/v6.2.1/css/all.css",])
# Create the layout with a map and a table
app.layout = html.Div([
dont_show,
html.Div(
id="superstore_search_display",
style={
"position": "absolute",
"left": "60px",
"top": "8vh",
"zIndex": "1001",
},
),
dmc.Grid(
children=[
dmc.Col(dl.Map(id="superstore_map", center=[39.8283, -98.5795], zoom=4, children=[
dl.TileLayer(),
dl.EasyButton(
icon="fa-search",
title="Search Map",
id="superstore_search_map_display_btn",
n_clicks=1,
),
dl.GeoJSON(
data=geojson_dict,
id="superstore_locations_layer",
cluster=True,
zoomToBoundsOnClick=True,
superClusterOptions=dict(radius=40),
hideout=dict(
category_colors=category_colors,
circleOptions=dict(fillOpacity=1, stroke=False, radius=3),
min=0,
),
clusterToLayer=cluster_to_layer,
),
dl.GeoJSON(
data=region_geojsons['East'],
id="superstore_regions_layer_east",
hoverStyle=arrow_function(dict(weight=5, color='#777', dashArray='')),
style=dict(weight=2, fillColor=region_colors['East'], fillOpacity=0.7)
),
dl.GeoJSON(
data=region_geojsons['West'],
id="superstore_regions_layer_west",
hoverStyle=arrow_function(dict(weight=5, color='#777', dashArray='')),
style=dict(weight=2, fillColor=region_colors['West'], fillOpacity=0.7)
),
dl.GeoJSON(
data=region_geojsons['Central'],
id="superstore_regions_layer_central",
hoverStyle=arrow_function(dict(weight=5, color='#777', dashArray='')),
style=dict(weight=2, fillColor=region_colors['Central'], fillOpacity=0.7)
),
dl.GeoJSON(
data=region_geojsons['South'],
id="superstore_regions_layer_south",
hoverStyle=arrow_function(dict(weight=5, color='#777', dashArray='')),
style=dict(weight=2, fillColor=region_colors['South'], fillOpacity=0.7)
)
], style={'height': '100vh', 'width': '100%', 'margin': "auto", "display": "block"}), span=12),
# dmc.Col(dcc.Graph(figure=fig_sankey, style={'height': '100vh', 'width': '100%', 'margin': "auto", "display": "block"}), span=6),
],
gutter="xl",
),
])
#########################################
# Setup Callbacks
#########################################
@callback(
Output("superstore_search_display", "children"),
Input("superstore_search_map_display_btn", "n_clicks"),
)
def show_search_map(n_clicks):
if n_clicks % 2 == 0:
return dmc.Stack(
[
dmc.TextInput(
placeholder="Filter Locations...",
style={"width": '95%', "margin-bottom": "9px"},
id="superstore_quick_filter_input",
),
dmc.Group(
[
dmc.Select(
# label='Select a State',
placeholder="Select a State / Provence",
id="superstore_autocomplete_r_map",
value="Everything",
data=state_select_data,
style={
"width": '45%',
"marginBottom": 10,
"color": "red",
},
),
dmc.Select(
placeholder="Category",
id="superstore_location_type",
value="everything",
data=[
{"label": "Everything", "value": "everything"},
{"label": "Office Supplies", "value": "Office Supplies"},
{"label": "Technology", "value": "Technology"},
{"label": "Furniture", "value": "Furniture"},
],
style={
"width": '45%',
"marginBottom": 10,
"color": "red",
},
),
],
grow=False,
position="left",
),
dag.AgGrid(
className="ag-theme-alpine-dark",
id="superstore_quick_filter_simple",
rowData=df.to_dict('records'),
columnDefs=[
{"headerName": i, "field": i, "width": '100%'} for i in df.columns
] + [
{
"headerName": "Profit",
"field": "Profit",
"cellStyle": {
"styleConditions": [
{
"condition": "params.value > 0",
"style": {"backgroundColor": "rgba(0, 255, 0, 0.3)"}
},
{
"condition": "params.value < 0",
"style": {"backgroundColor": "rgba(255, 0, 0, 0.3)"}
},
{
"condition": "params.value == 0",
"style": {"backgroundColor": "rgba(255, 255, 255, 0.3)"}
}
]
},
"width": '100%'
}
],
defaultColDef={"filter": False, "editable": False},
dashGridOptions={
'suppressMenuHide': True,
"rowSelection": "single",
"animateRows": False,
"pagination": False,
},
style={},
),
]
)
else:
return []
@callback(
Output("superstore_map", "viewport", allow_duplicate=True),
Output("superstore_quick_filter_simple", "rowData", allow_duplicate=True),
Input("superstore_autocomplete_r_map", "value"),
prevent_initial_call=True,
)
def search_state_map(value):
if value == "Everything":
return dict(center=[39.8283, -98.5795], zoom=4, transition="flyTo"), df.to_dict("records")
else:
filtered_df = df[df['State/Province'] == value]
if not filtered_df.empty:
center_lat = filtered_df['LAT'].mean()
center_lon = filtered_df['LNG'].mean()
return dict(center=[center_lat, center_lon], zoom=6, transition="flyTo"), filtered_df.to_dict("records")
else:
return no_update, no_update
@callback(
Output("superstore_quick_filter_simple", "dashGridOptions"),
Output("superstore_locations_layer", "data", allow_duplicate=True),
Output("superstore_quick_filter_simple", "rowData", allow_duplicate=True),
Input("superstore_quick_filter_input", "value"),
Input("superstore_location_type", "value"),
Input('superstore_autocomplete_r_map', 'value'),
prevent_initial_call=True,
)
def update_filter_and_locations_layer(filter_value, location_type, state):
# Filter by state
if state == "Everything":
rowData = df
else:
rowData = df[df['State/Province'] == state]
# Filter by category
if location_type != "everything":
rowData = rowData[rowData['Category'] == location_type]
# Filter by name (assuming you want to filter by Customer Name)
if filter_value:
rowData = rowData[rowData['Customer Name'].str.contains(f'{filter_value}', case=False, na=False)]
# Create GeoJSON features with tooltip
features = []
for _, row in rowData.iterrows():
features.append({
"type": "Feature",
"geometry": {
"type": "Point",
"coordinates": [row["LNG"], row["LAT"]],
},
"properties": {
"Category": row['Category'],
"tooltip": f"Customer Name: {row['Customer Name']}<br>Segment: {row['Segment']}<br>Country/Region: {row['Country/Region']}<br>City: {row['City']}<br>State/Province: {row['State/Province']}<br>Postal Code: {row['Postal Code']}<br>Region: {row['Region']}<br>Product ID: {row['Product ID']}<br>Category: {row['Category']}<br>Sub-Category: {row['Sub-Category']}<br>Product Name: {row['Product Name']}<br>Sales: {row['Sales']}<br>Quantity: {row['Quantity']}<br>Discount: {row['Discount']}<br>Profit: {row['Profit']}"
}
})
geojson_dict = {
"type": "FeatureCollection",
"features": features
}
# Update the quick filter
newFilter = Patch()
newFilter["quickFilterText"] = filter_value
return newFilter, geojson_dict, rowData.to_dict("records")
@callback(
Output("superstore_map", "viewport", allow_duplicate=True),
Input("superstore_quick_filter_simple", "selectedRows"),
prevent_initial_call=True,
)
def ag_grid_selection(selected_rows):
if selected_rows:
return dict(
center=[selected_rows[0]['LAT'], selected_rows[0]['LNG']],
zoom=10,
transition="flyTo",
)
else:
return no_update
# Run the app
if __name__ == '__main__':
app.run_server(debug=True)
![]() If you prefer to collaborate with others on Discord, join the Plotly Discord channel.
If you prefer to collaborate with others on Discord, join the Plotly Discord channel.