FIFA World Cup - Plotly App Challenge

:soccer_ball: The FIFA World Cup is one of the biggest sporting events worldwide. To build on that momentum, we would like to challenge the community to build the best Dash app or Plotly Studio app possible to cover the event.

The goal is to create apps that the world can use in order to follow the World Cup statistics throughout the tournament.

To participate in the challenge, you will need to connect to a data source that feeds daily World Cup data and stats into your app: Football-Data and FBREF are possible sources (thank you Maov), but you are permitted to use other data sources as well.

The winning apps will be judged according to the following categories:

  • Data exploration and insights
  • App UI/UX Design
  • Implementation of unique features not communly seen in a Dash or Plotly Studio app

Apps must go live by end of the day June 14, 2026. However, you can continue improving your app until June 30, at which point the Plotly Judging Committee will start judging the apps.

To enter your submission, please follow the next steps by end of day June 14:

  • publish your app to Plotly Cloud and submit the app link as a new post in this thread.
  • post about the app on social media (Linkedin, X, or Bluesky).
  • include a short description of the app; if it’s a Dash app, please include your code on GitHub.

The winners will be announced a few weeks later and will receive a reward of:

  • *$250 for best Dash app, $250 for best Plotly Studio app
  • $150 for second place
  • $50 for third place

*Only one prize per community member

For any questions, feel free to reply to the Forum topic or message me directly.

FIFA World Cup 2026 Dashboard

This Plotly Studio Dashboard shows the 2026 FIFA World Cup in real time.

Data source: football-data.org API (2026 season), with 5-minute in-memory caching to stay within the 10 req/min free tier limit.

Pages:

  • Overview —KPI-s, match timeline, status distribution, and a full results table showing date, teams and final scores
  • Standings — group table with dropdown selector, goals for/against chart, win/draw/loss pie
  • Matches — filterable match list, matches by stage chart
  • Players — top scorers and team metrics

*This is an early version — the dashboard is still in development and will continue to improve until June 30.
*

Hi, Community!

Introducing STATDIUM :soccer_ball: - my entry for the FIFA World Cup - Plotly App Challenge!

Built a full real-time analytics platform for FIFA World Cup 2026: 48 teams, 12 groups, 104 matches; powered by live data, zero shortcuts.

What’s Inside:

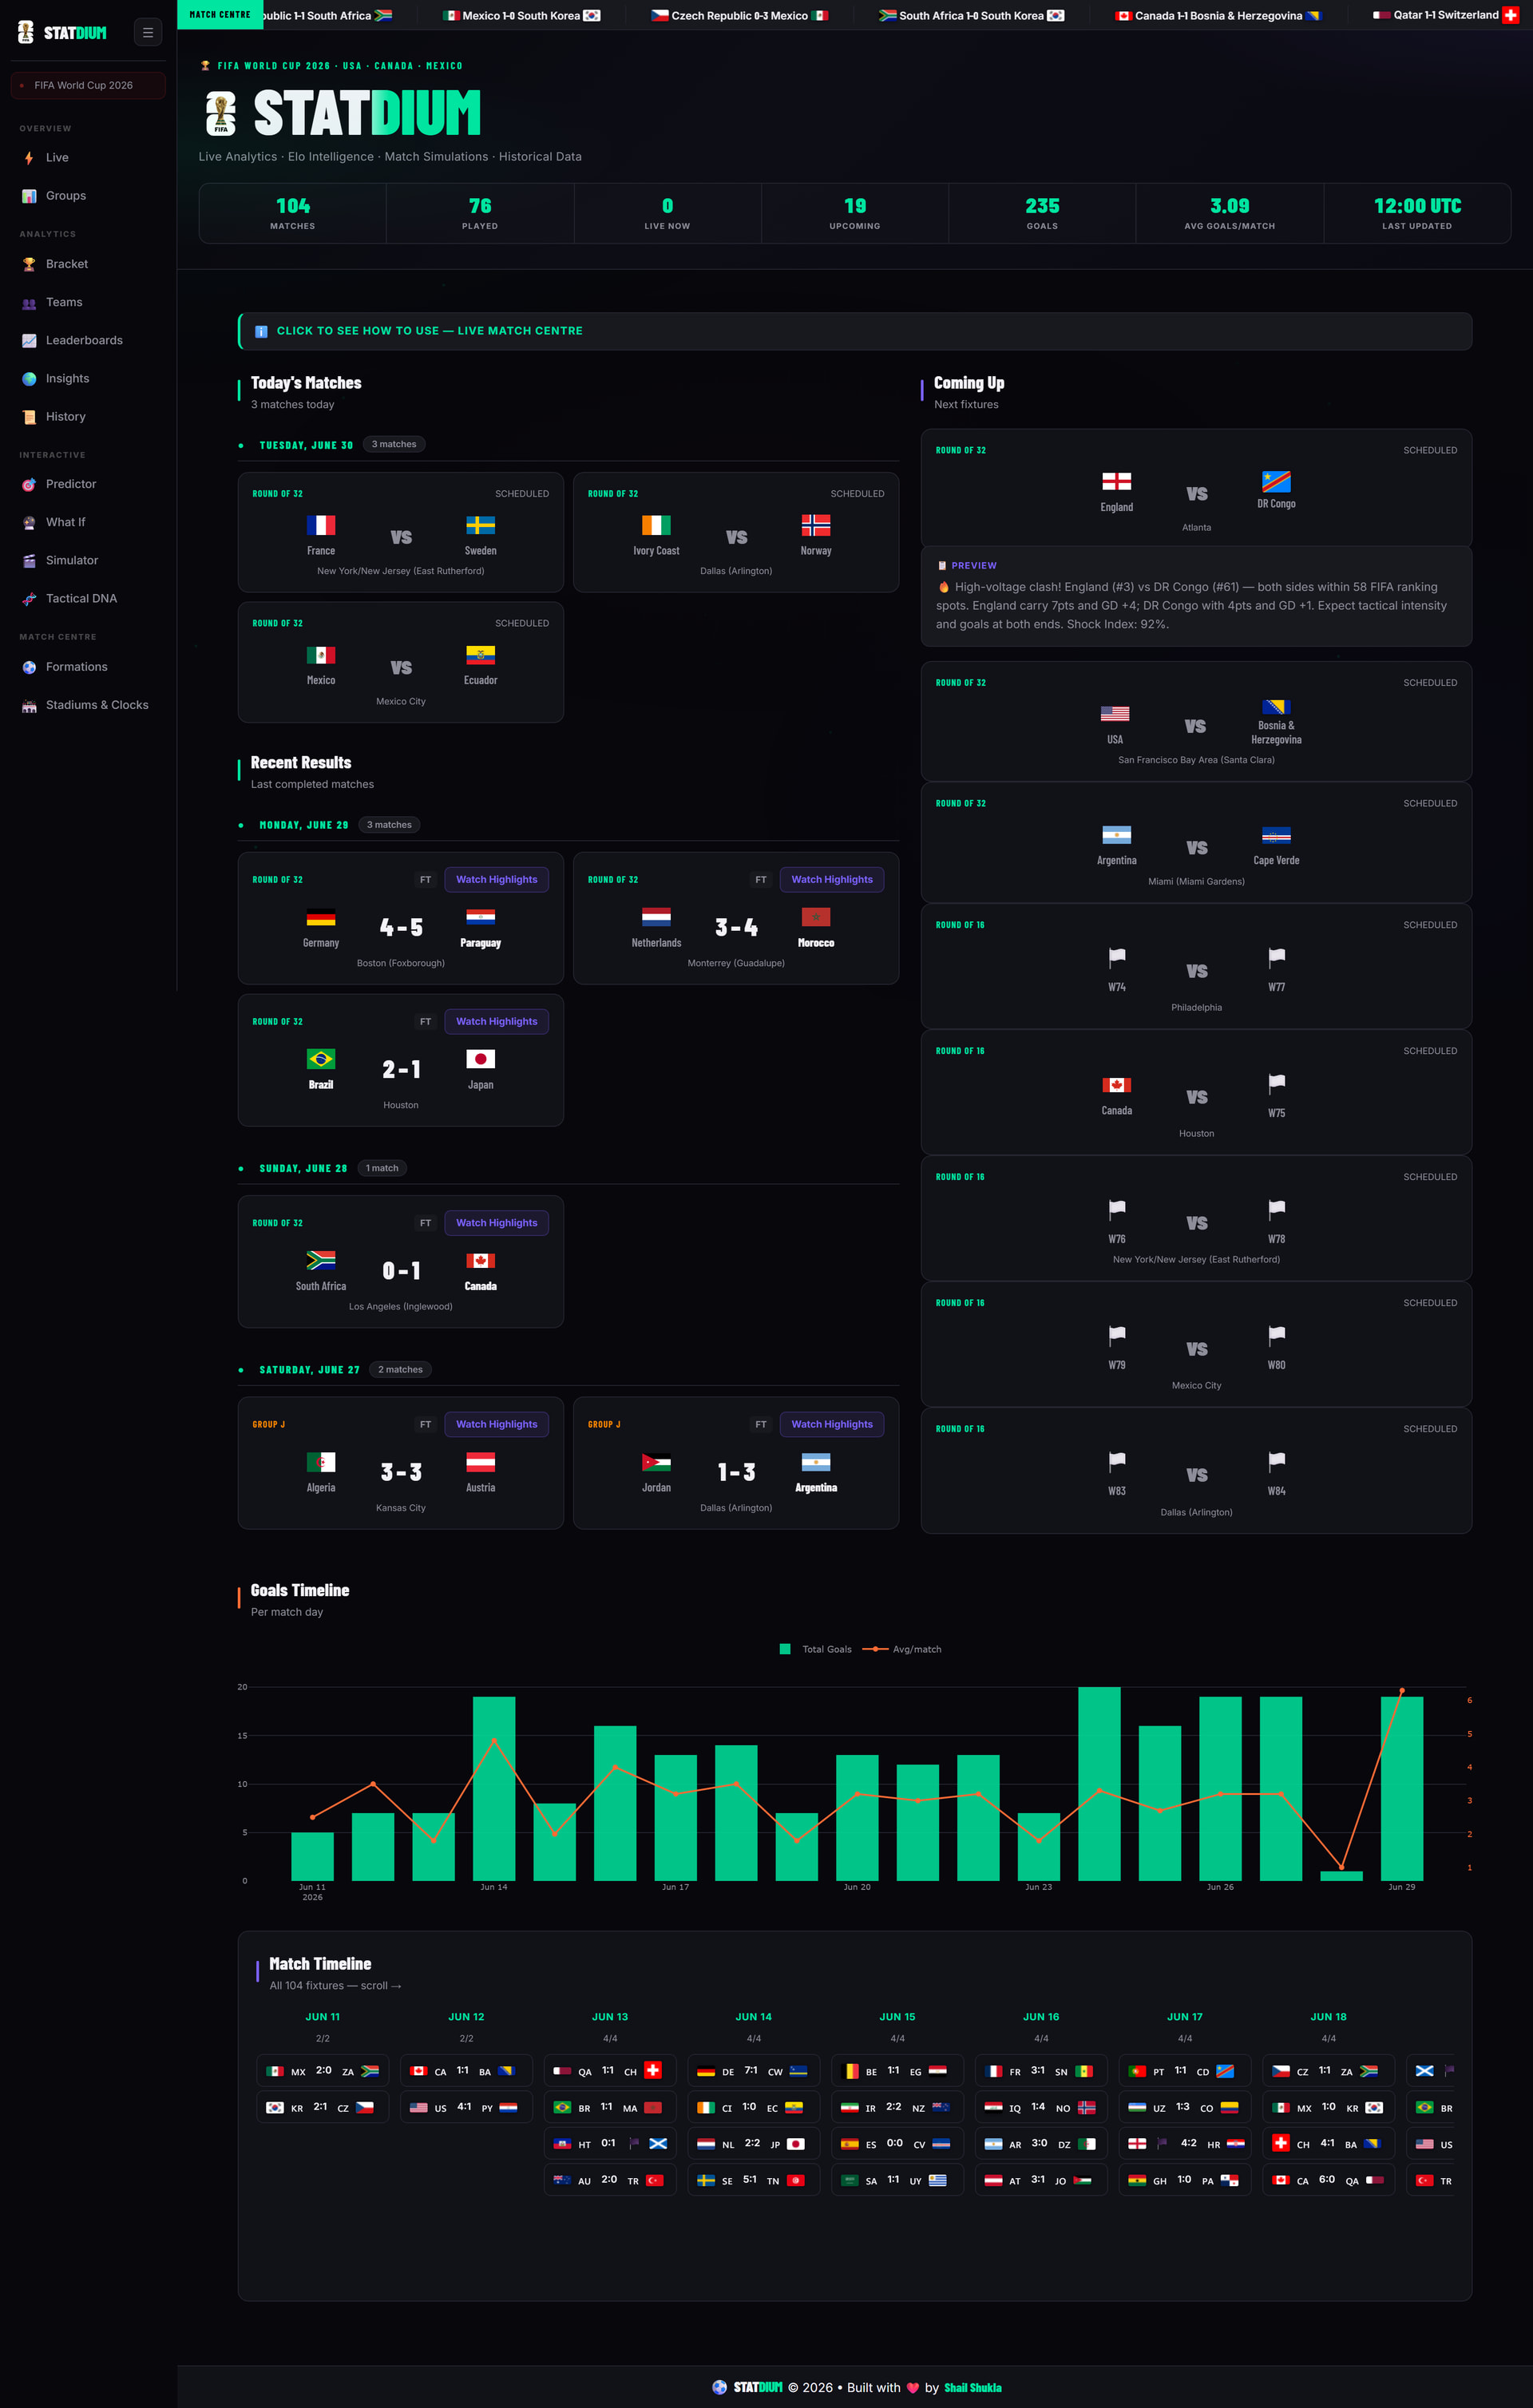
:high_voltage: Live Scores - auto-refreshing every 30s with a scrolling goal ticker across the top

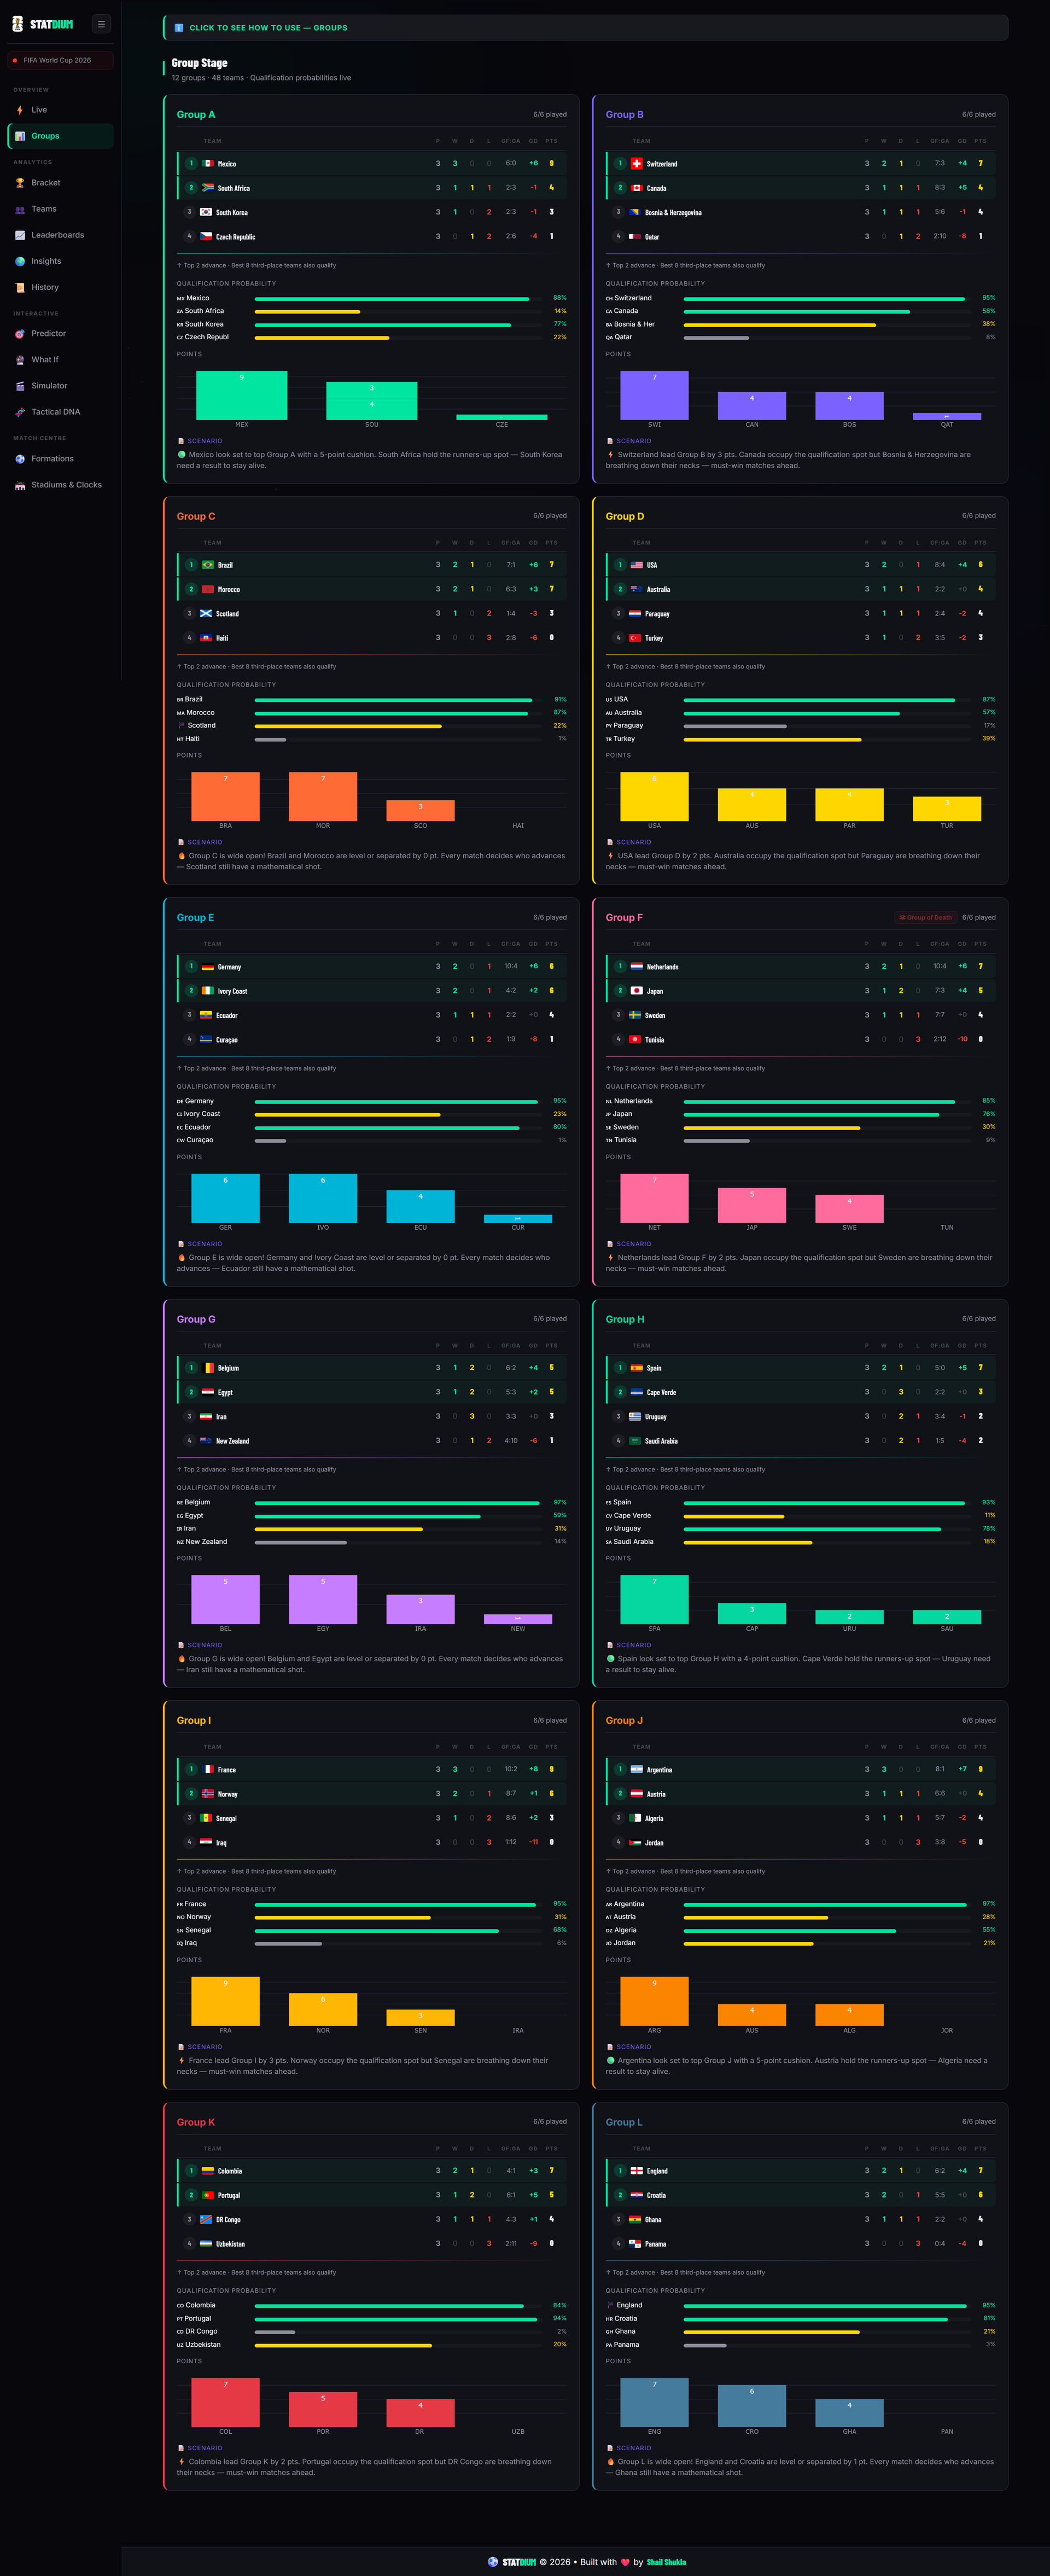
:bar_chart: Group Stage - all 12 groups with live standings, qualification probability bars, and Group of Death detection

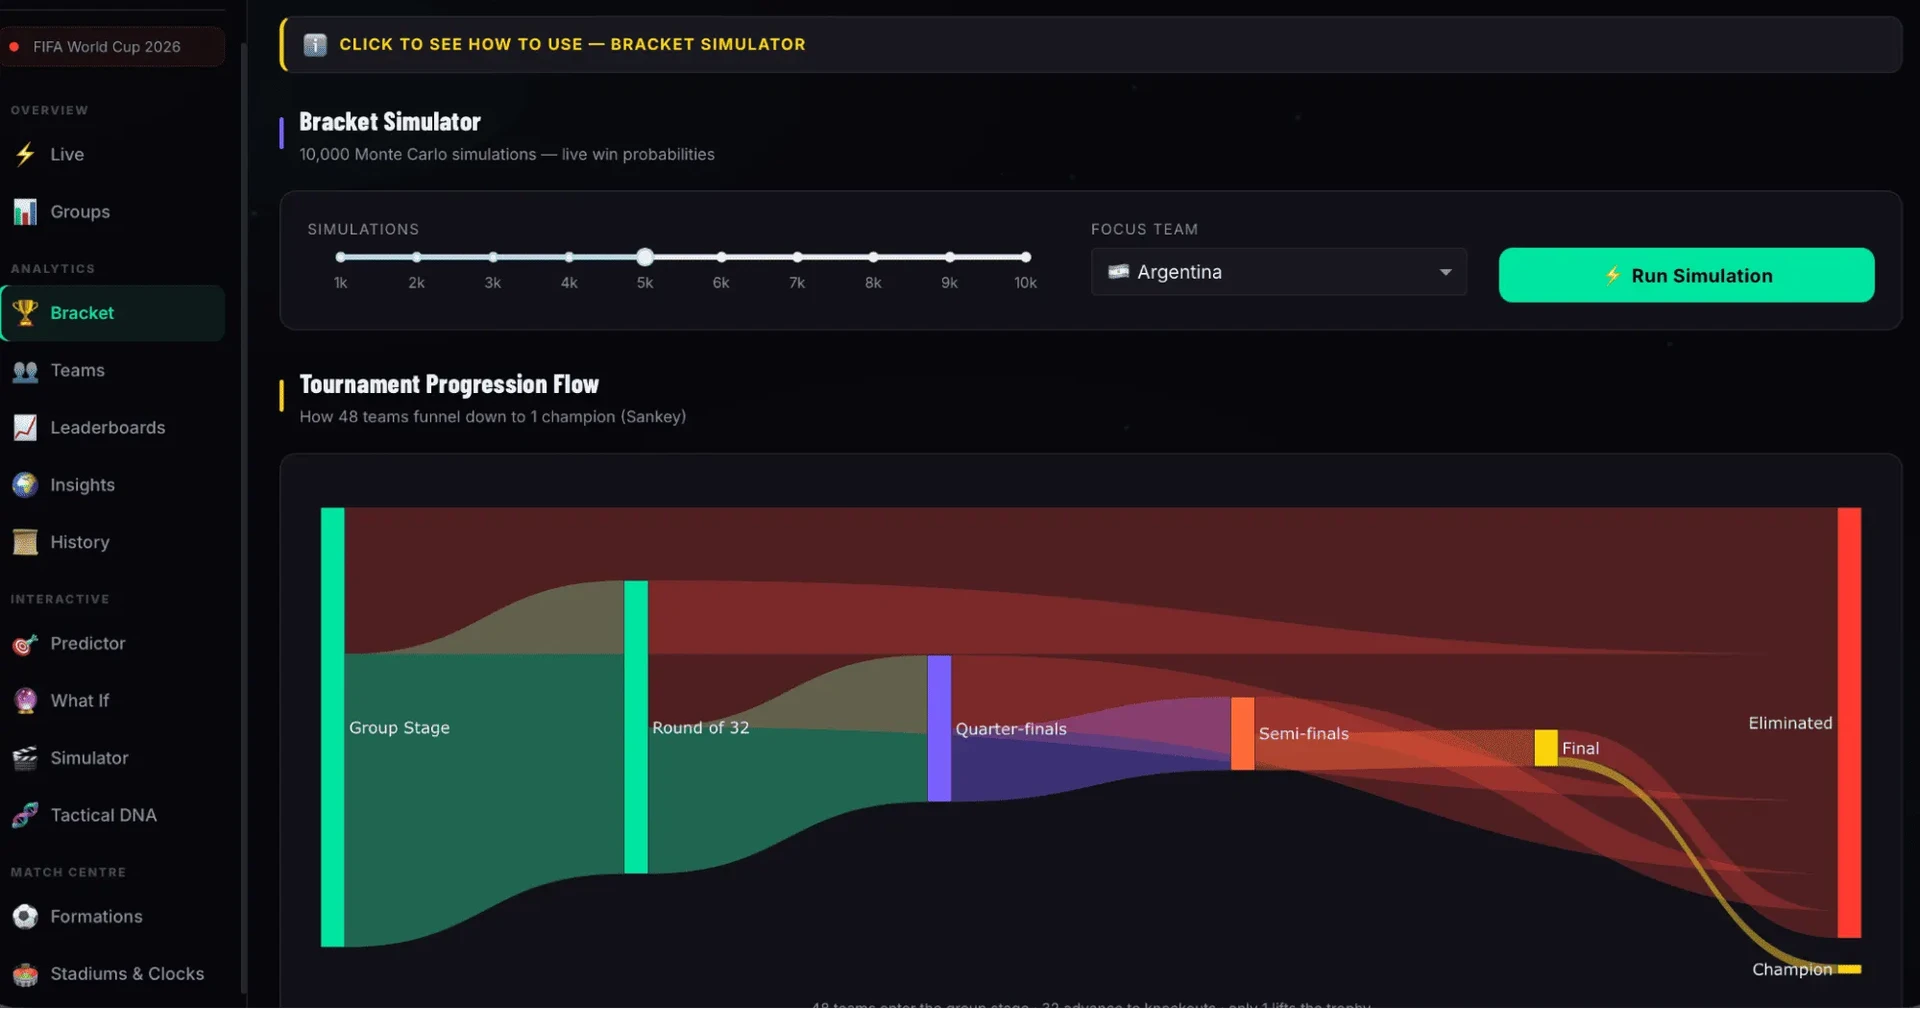
:bullseye: Monte Carlo Bracket Simulator - 10,000 tournament simulations on demand → championship probability heatmap + “Path to Glory” funnel per team

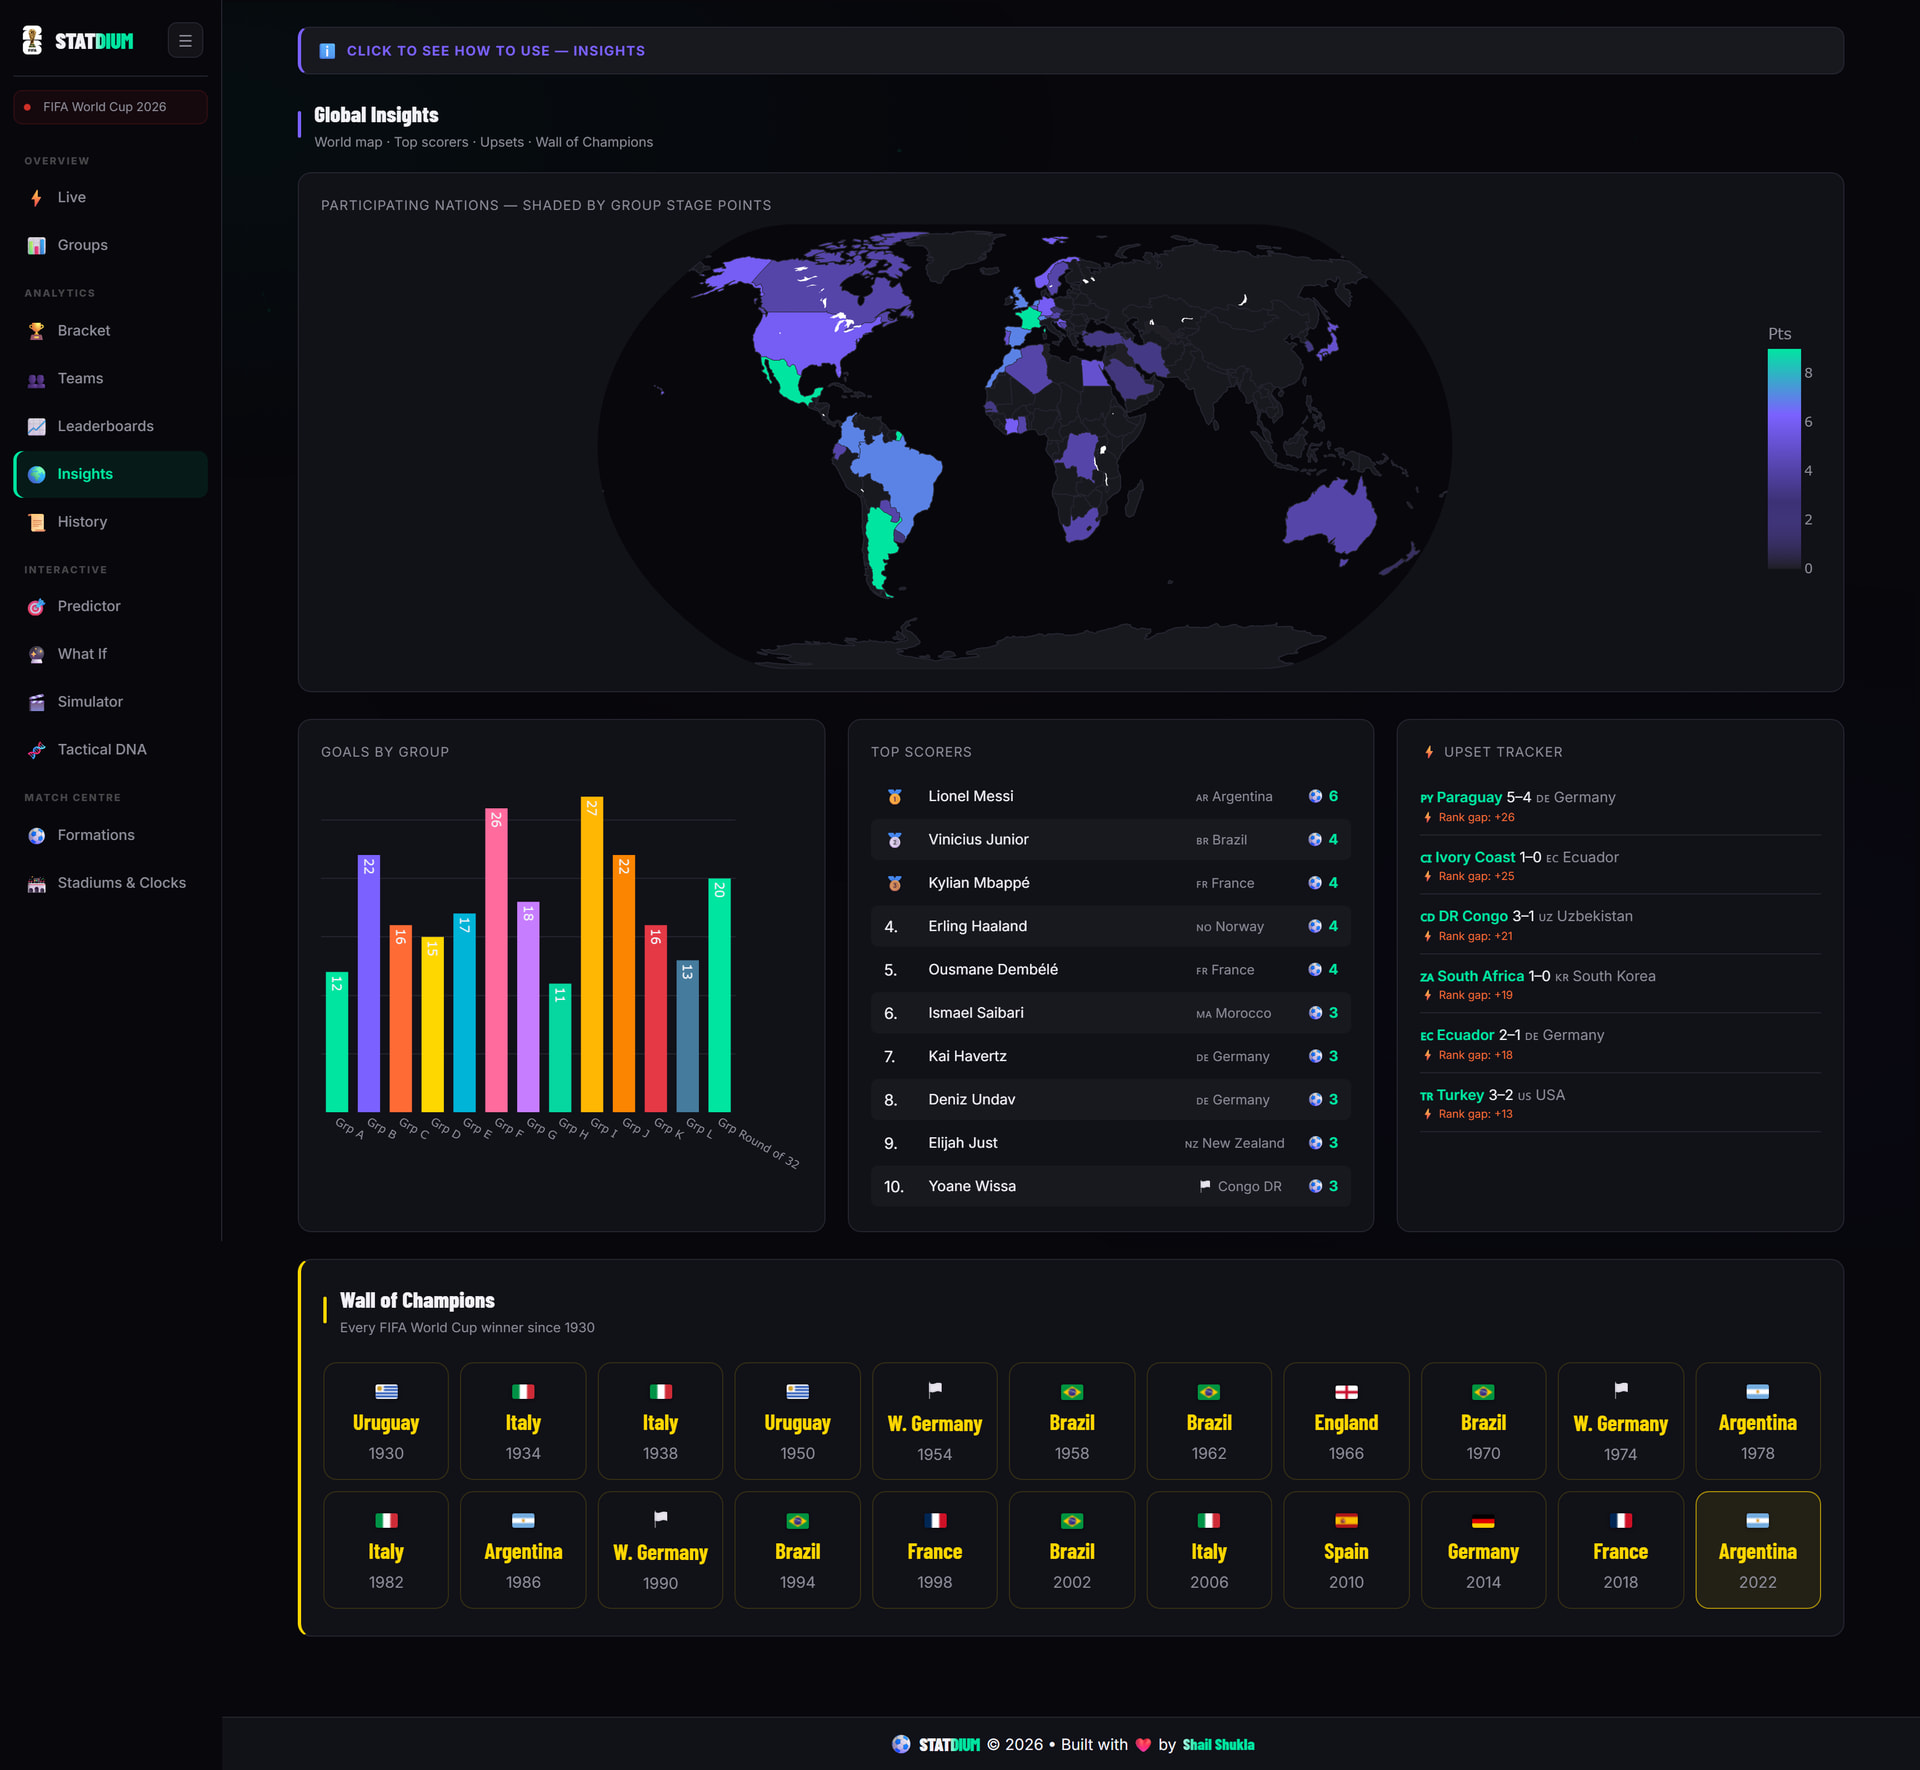
:globe_showing_europe_africa: Global Insights - interactive choropleth world map shaded by points, upset tracker, Wall of Champions since 1930

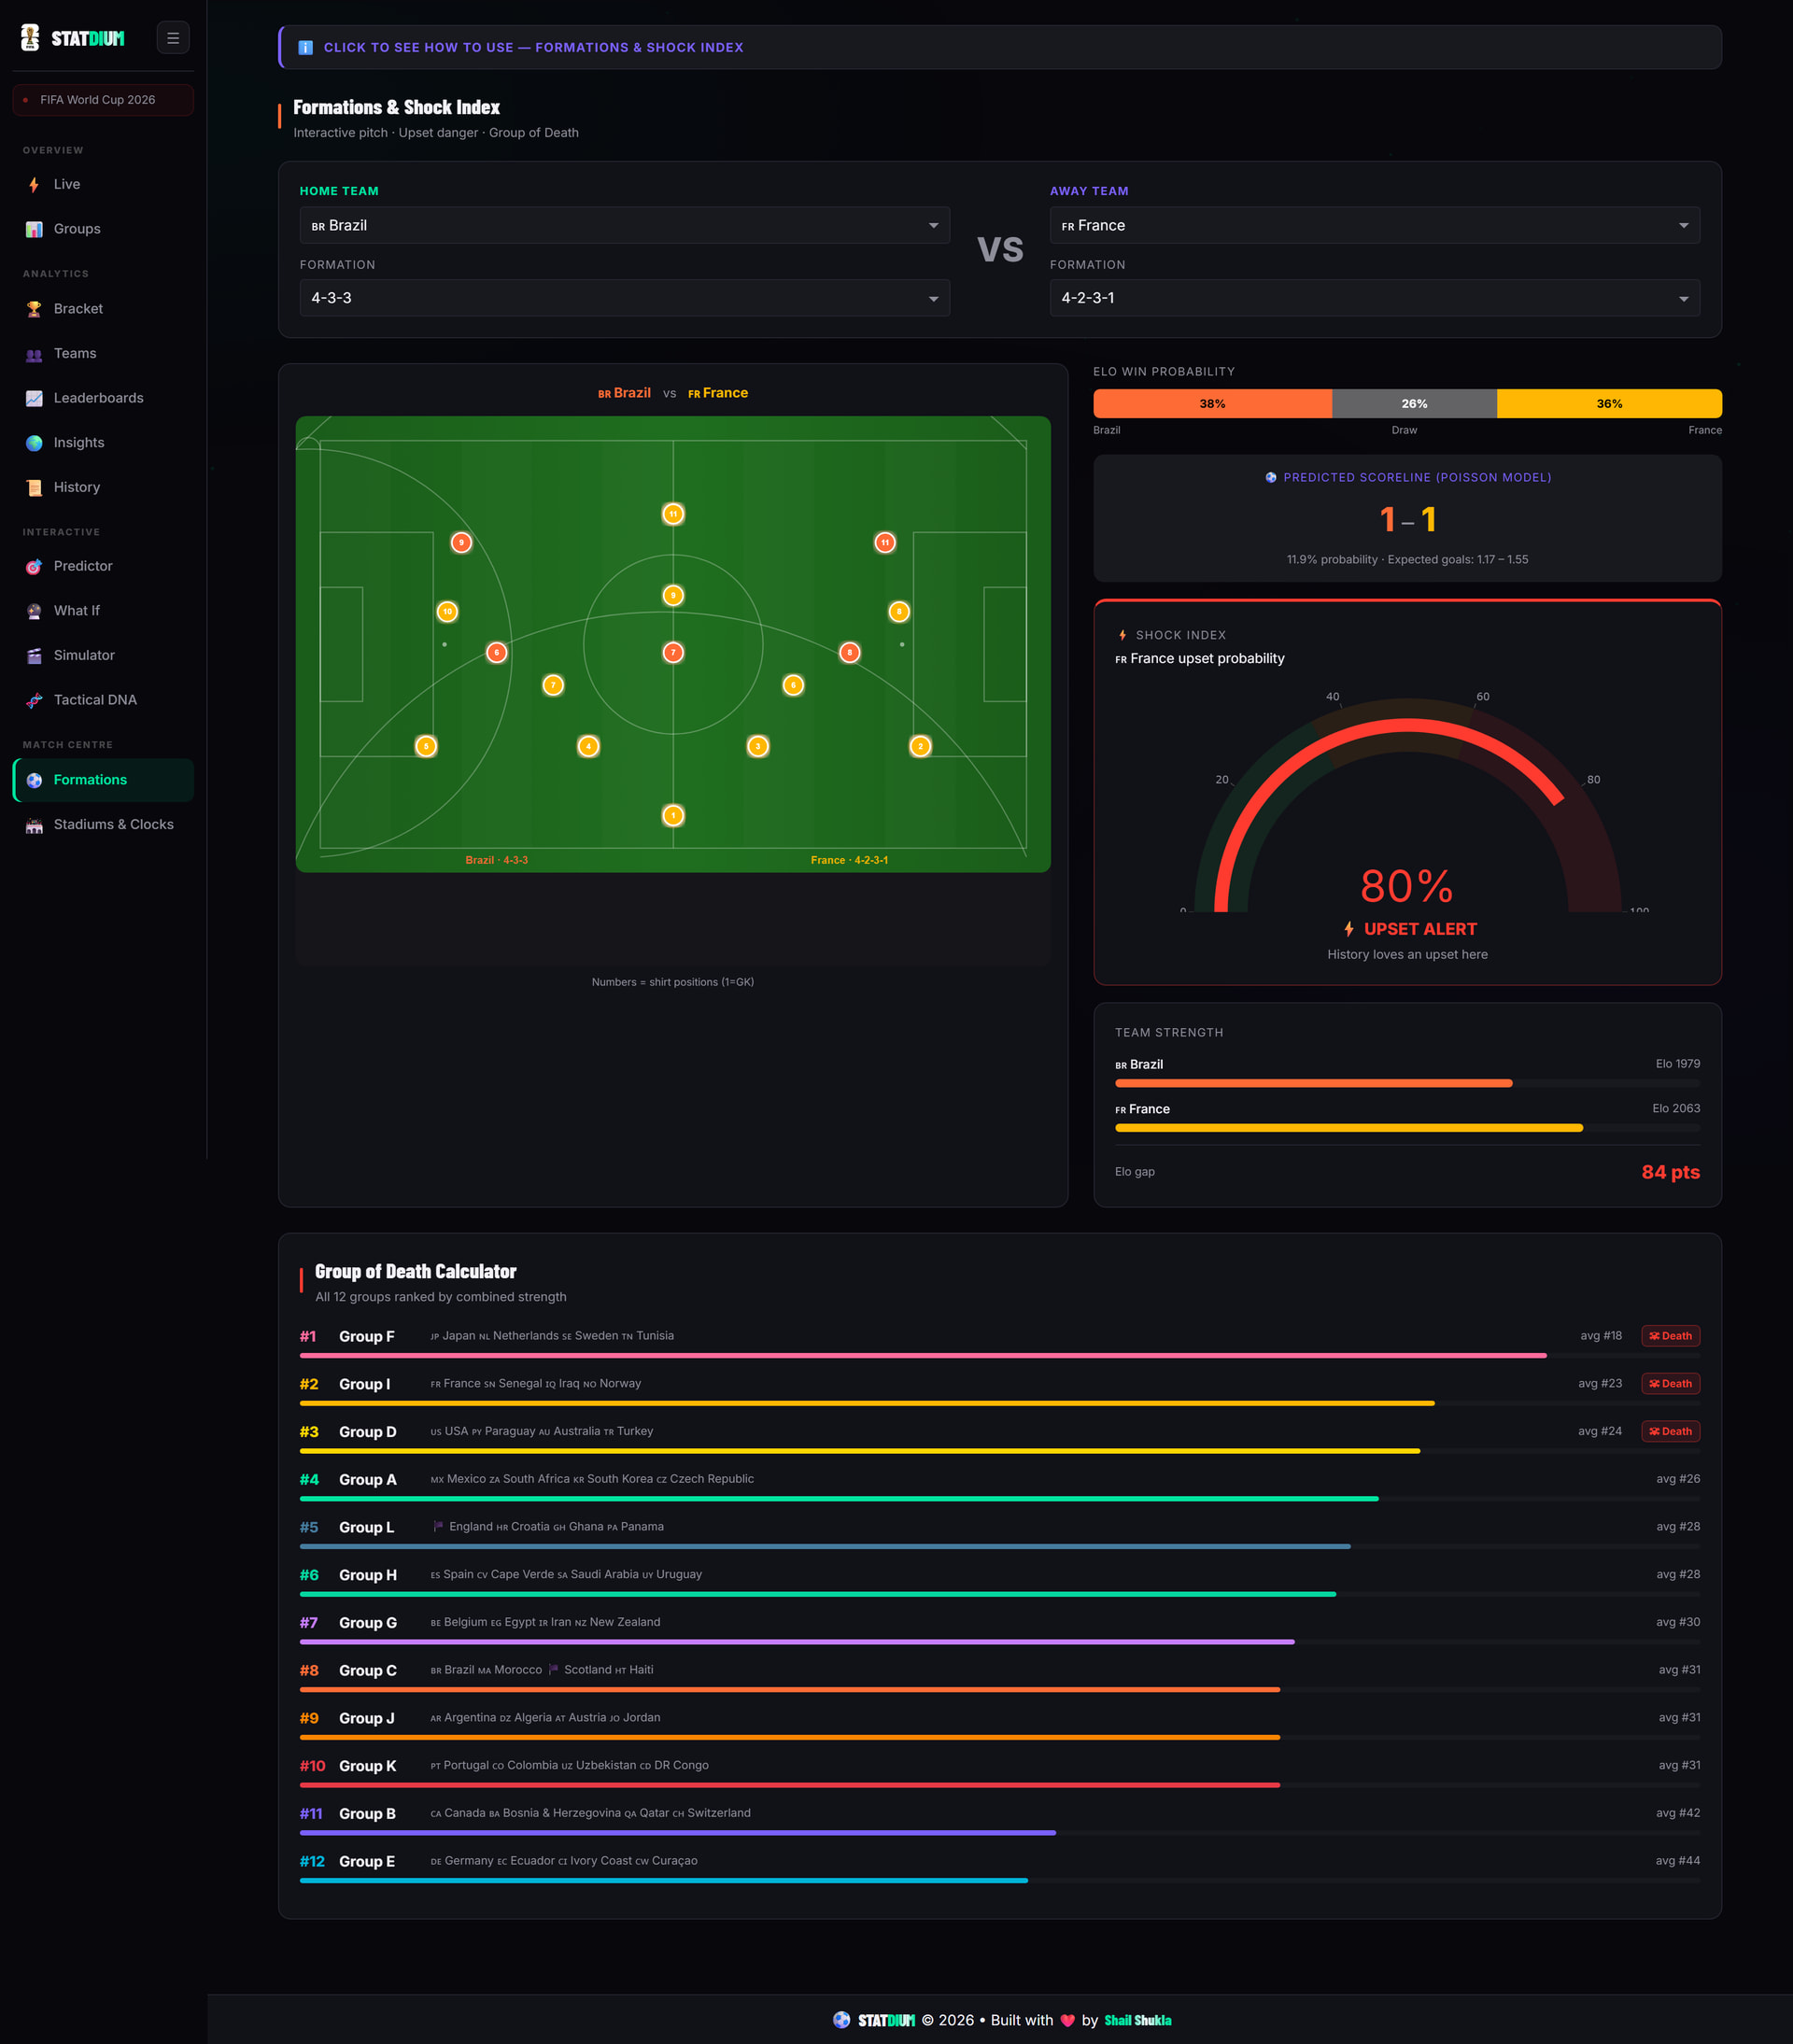
:soccer_ball: Formation Viewer - interactive pitch SVG with any formation (4-3-3, 4-2-3-1, 3-5-2…) vs any opponent, plus a Shock Index gauge showing upset probability based on FIFA ranking gap

This was built for the love of football and data. If you’re following the World Cup, give it a spin! :fire:

Live App​:link:: https://statdium-fifa-world-cup-2026.onrender.com/

GitHub: GitHub - Shail-1799/STATDIUM · GitHub

@adamschroeder

I updated my app, there are more pages, what I didnt upload yesterday.

linkedin: #plotlystudio #challenge | Eszter Kovacs

Nice looking app.

Some of your stats didn’t update, like how many matches have been played for Group D.

The site is not great for mobile. The navbar and cards don’t fit in the window, cause a scroll for x.

My submission for the FIFA World Cup - Plotly App Challenge — mobile-friendly, so the stats follow you wherever the match takes you. All match times and upcoming fixtures displayed in your local timezone — no conversion needed.

App: https://164208b3-4aa9-46fb-b858-02bf7b78b4db.plotly.app/
Code: GitHub - deepa-shalini-k/plotly-fifa-2026-app: FIFA 2026 live tracking app with key tournament metrics, live formations, leaderboards and real-time elo ratings · GitHub

  • Tournament KPIs and metrics, updated in real time
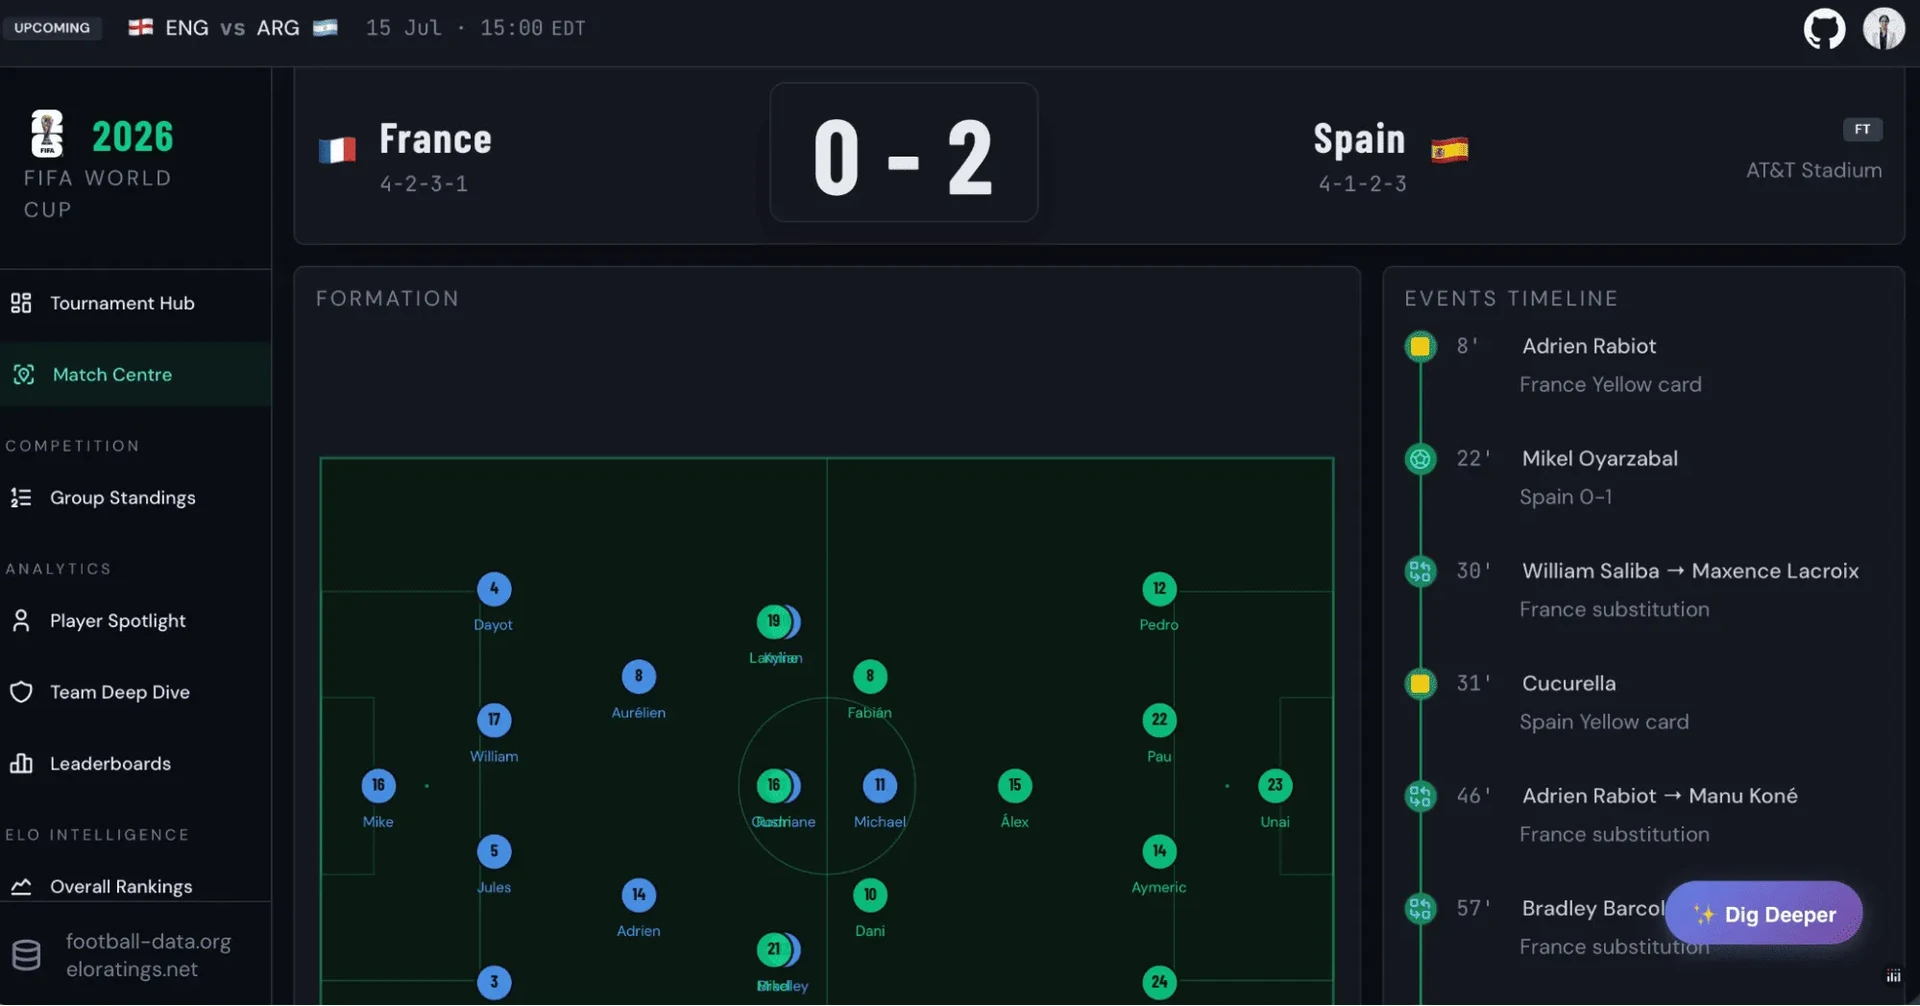
  • Live match formations — full 11v11 on an interactive football pitch
  • Goal-by-goal match timeline with scorer and minute
  • Past match formations and events, fully preserved
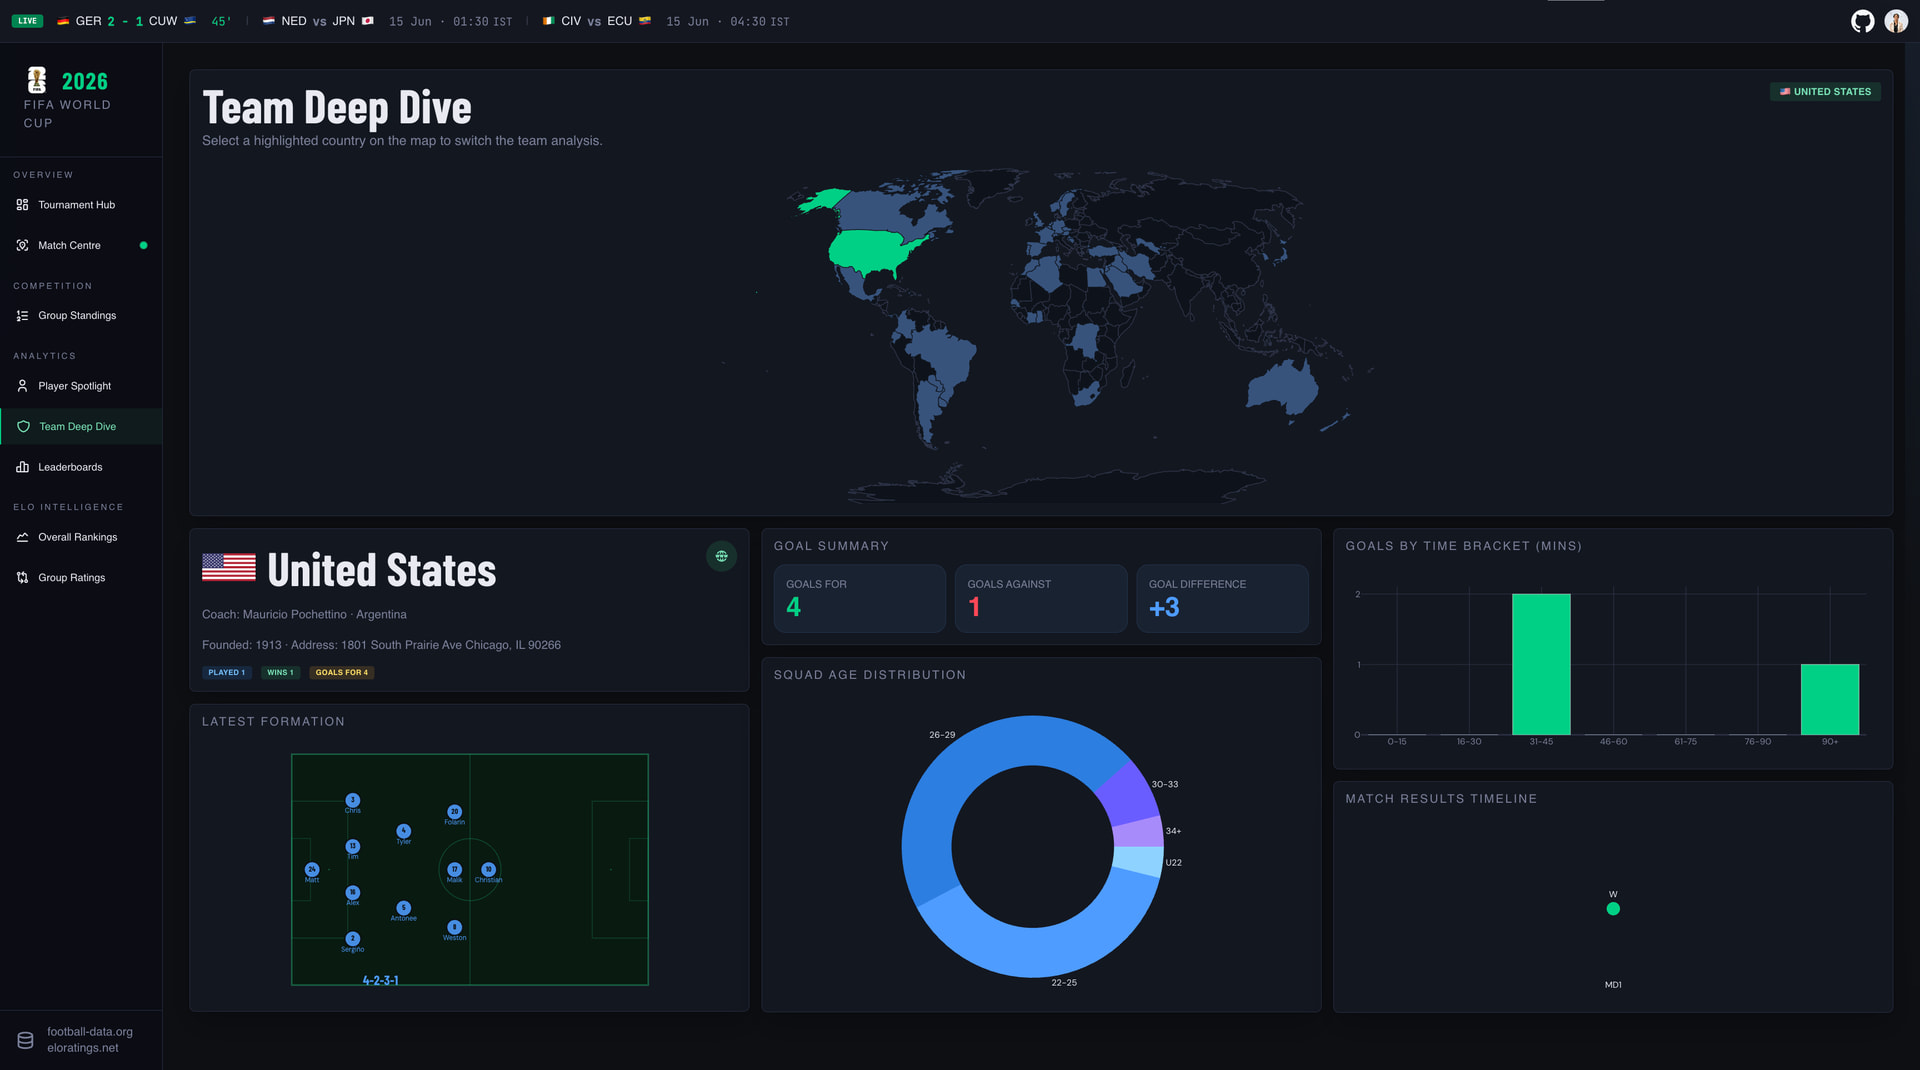
  • Team deep dive across all 48 nations — formation, squad profile, tournament stats
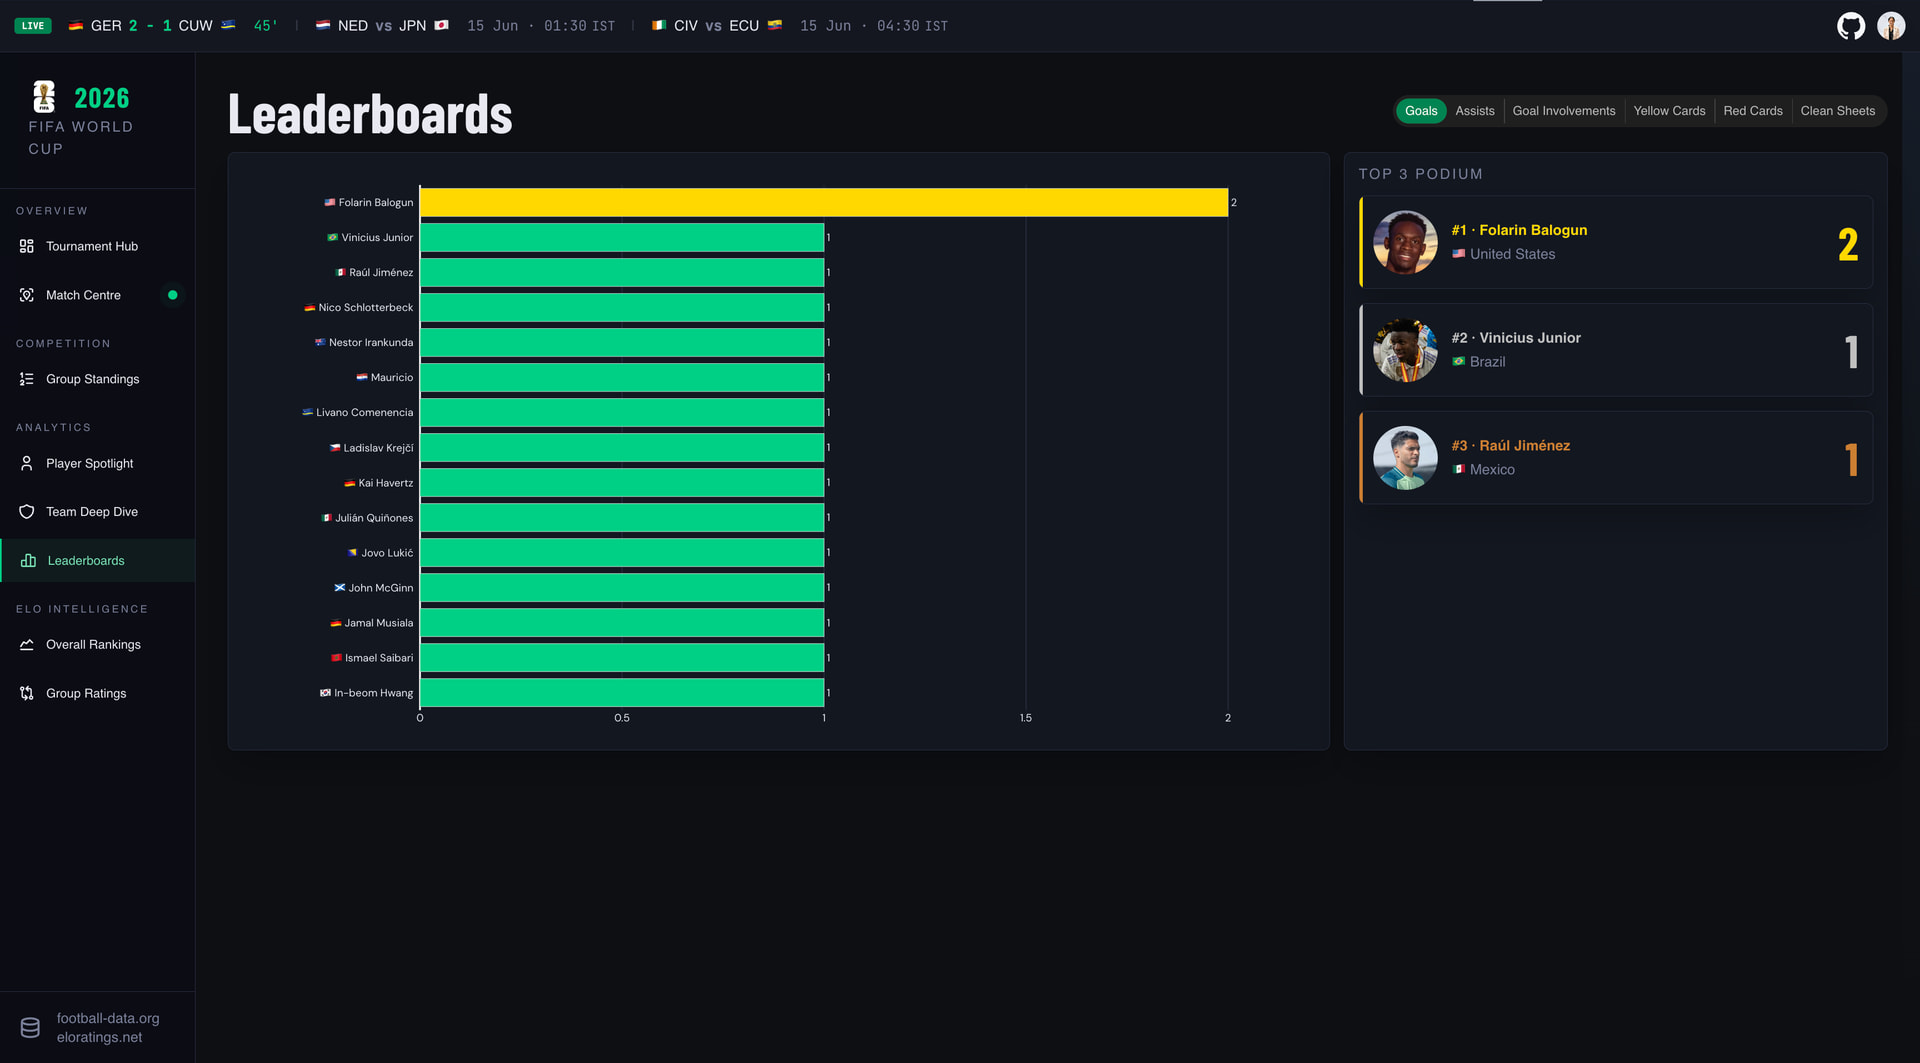
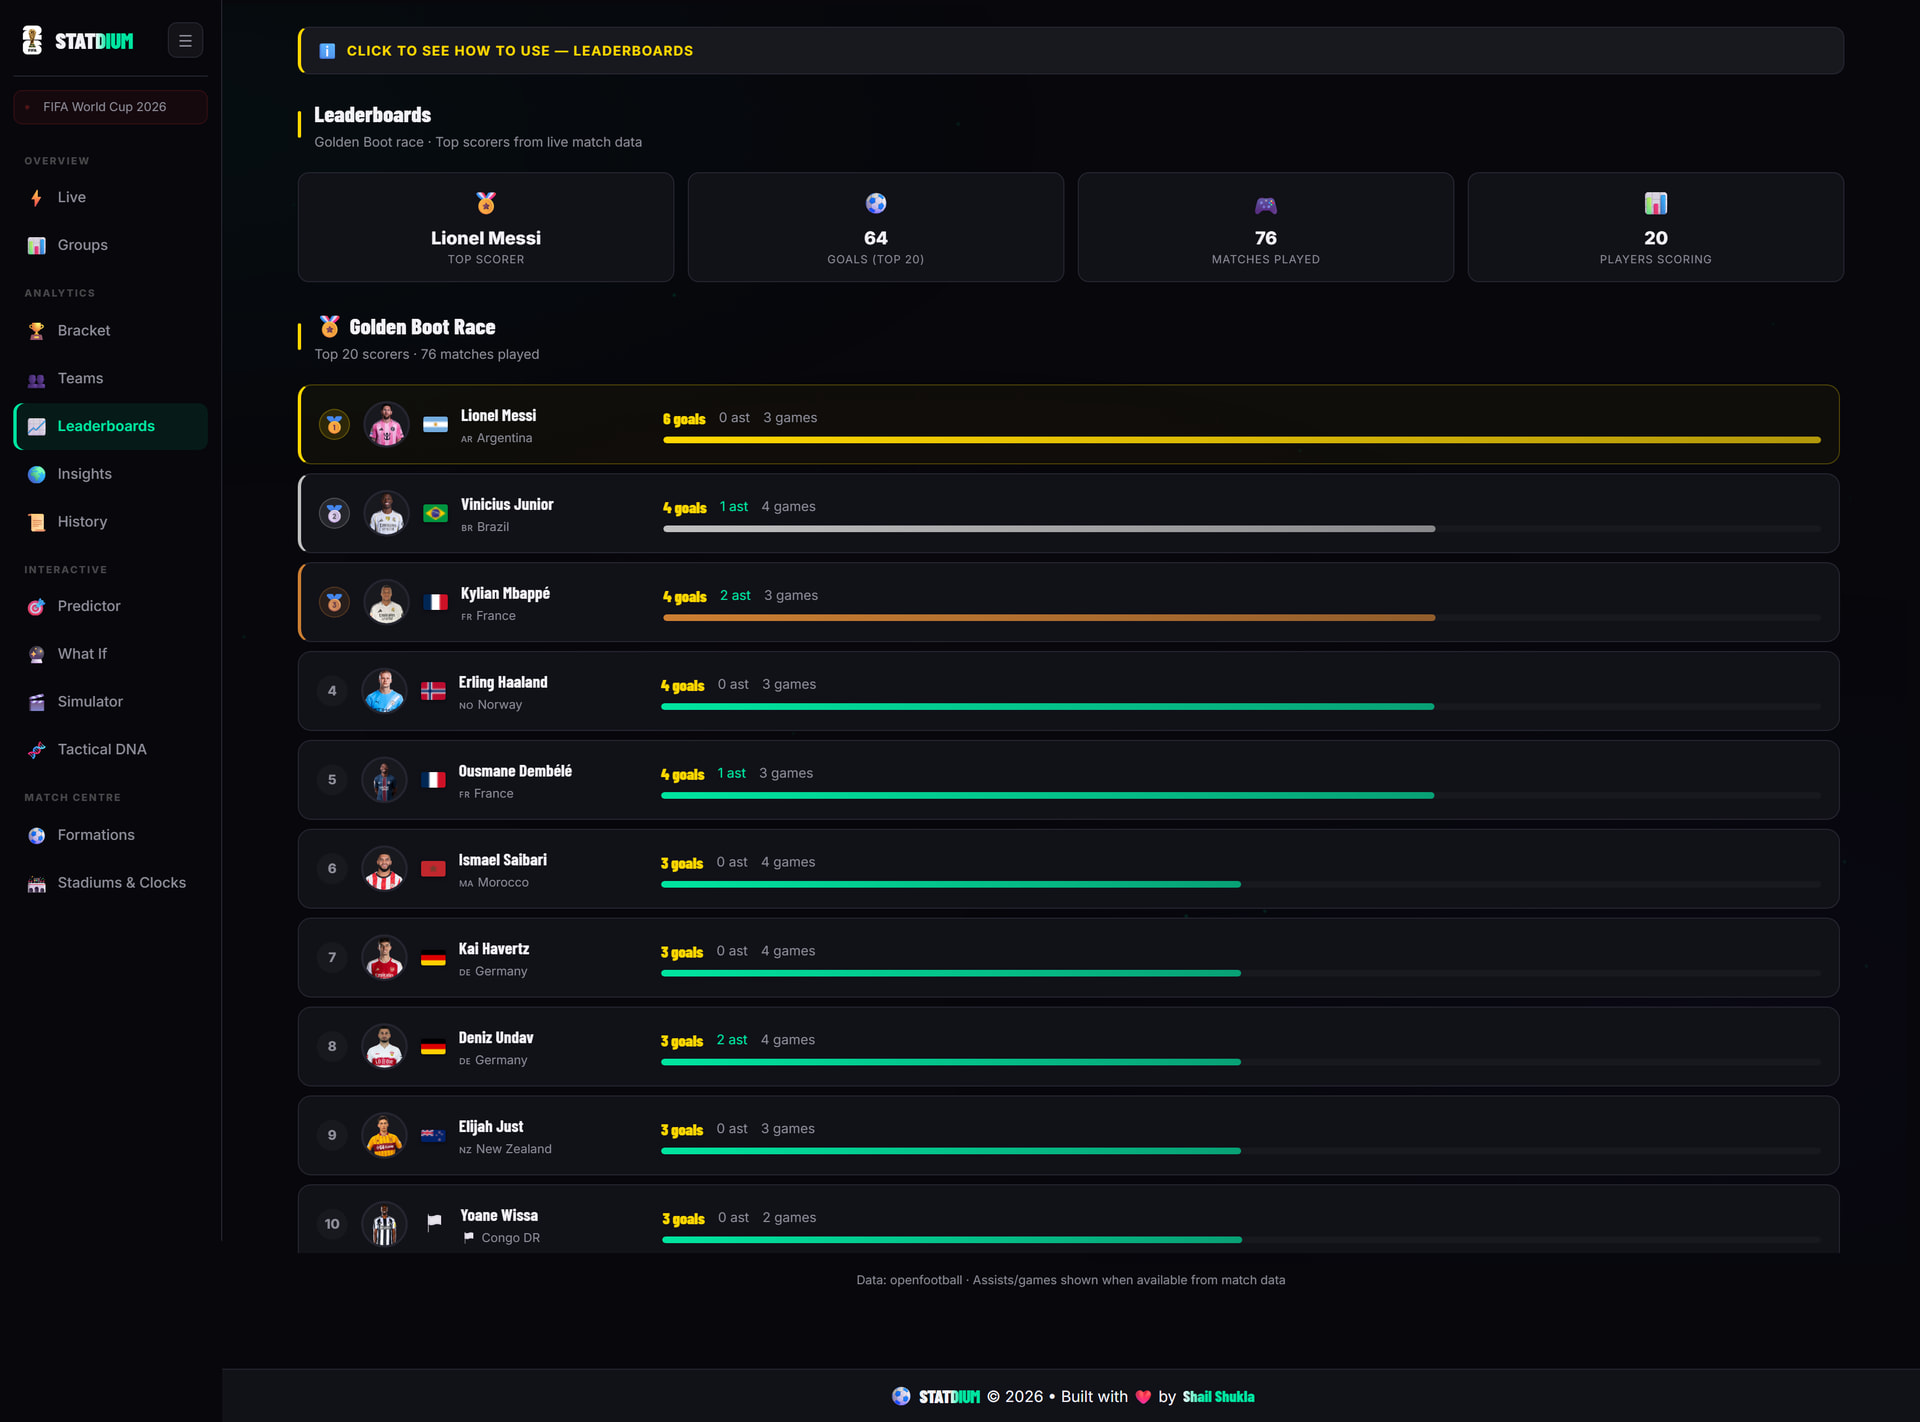
  • Leaderboards — Golden Boot race, assists, goal involvements
  • Elo intelligence — real-time rating updates after every result, driving win probabilities, qualification probabilities, and tournament winner predictions

LinkedIn post

Sources: https://www.football-data.org/, https://eloratings.net/

@adamschroeder

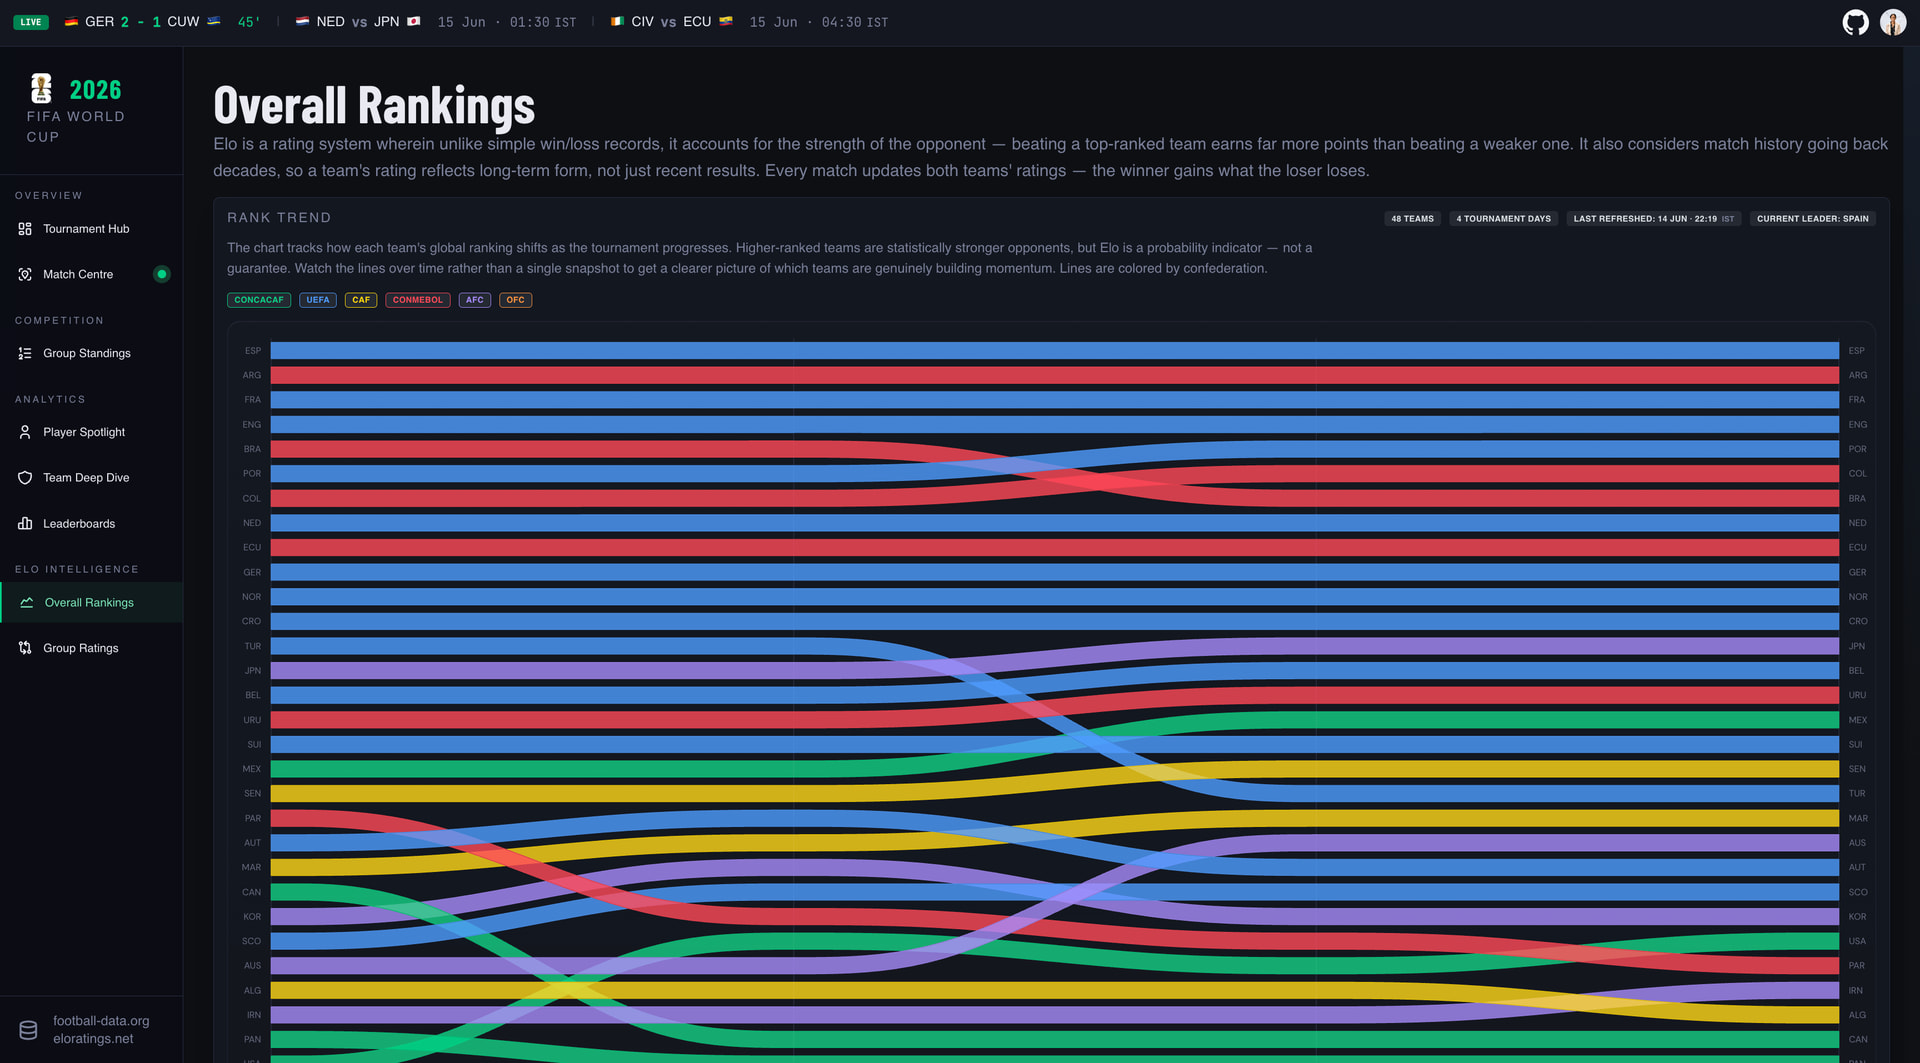
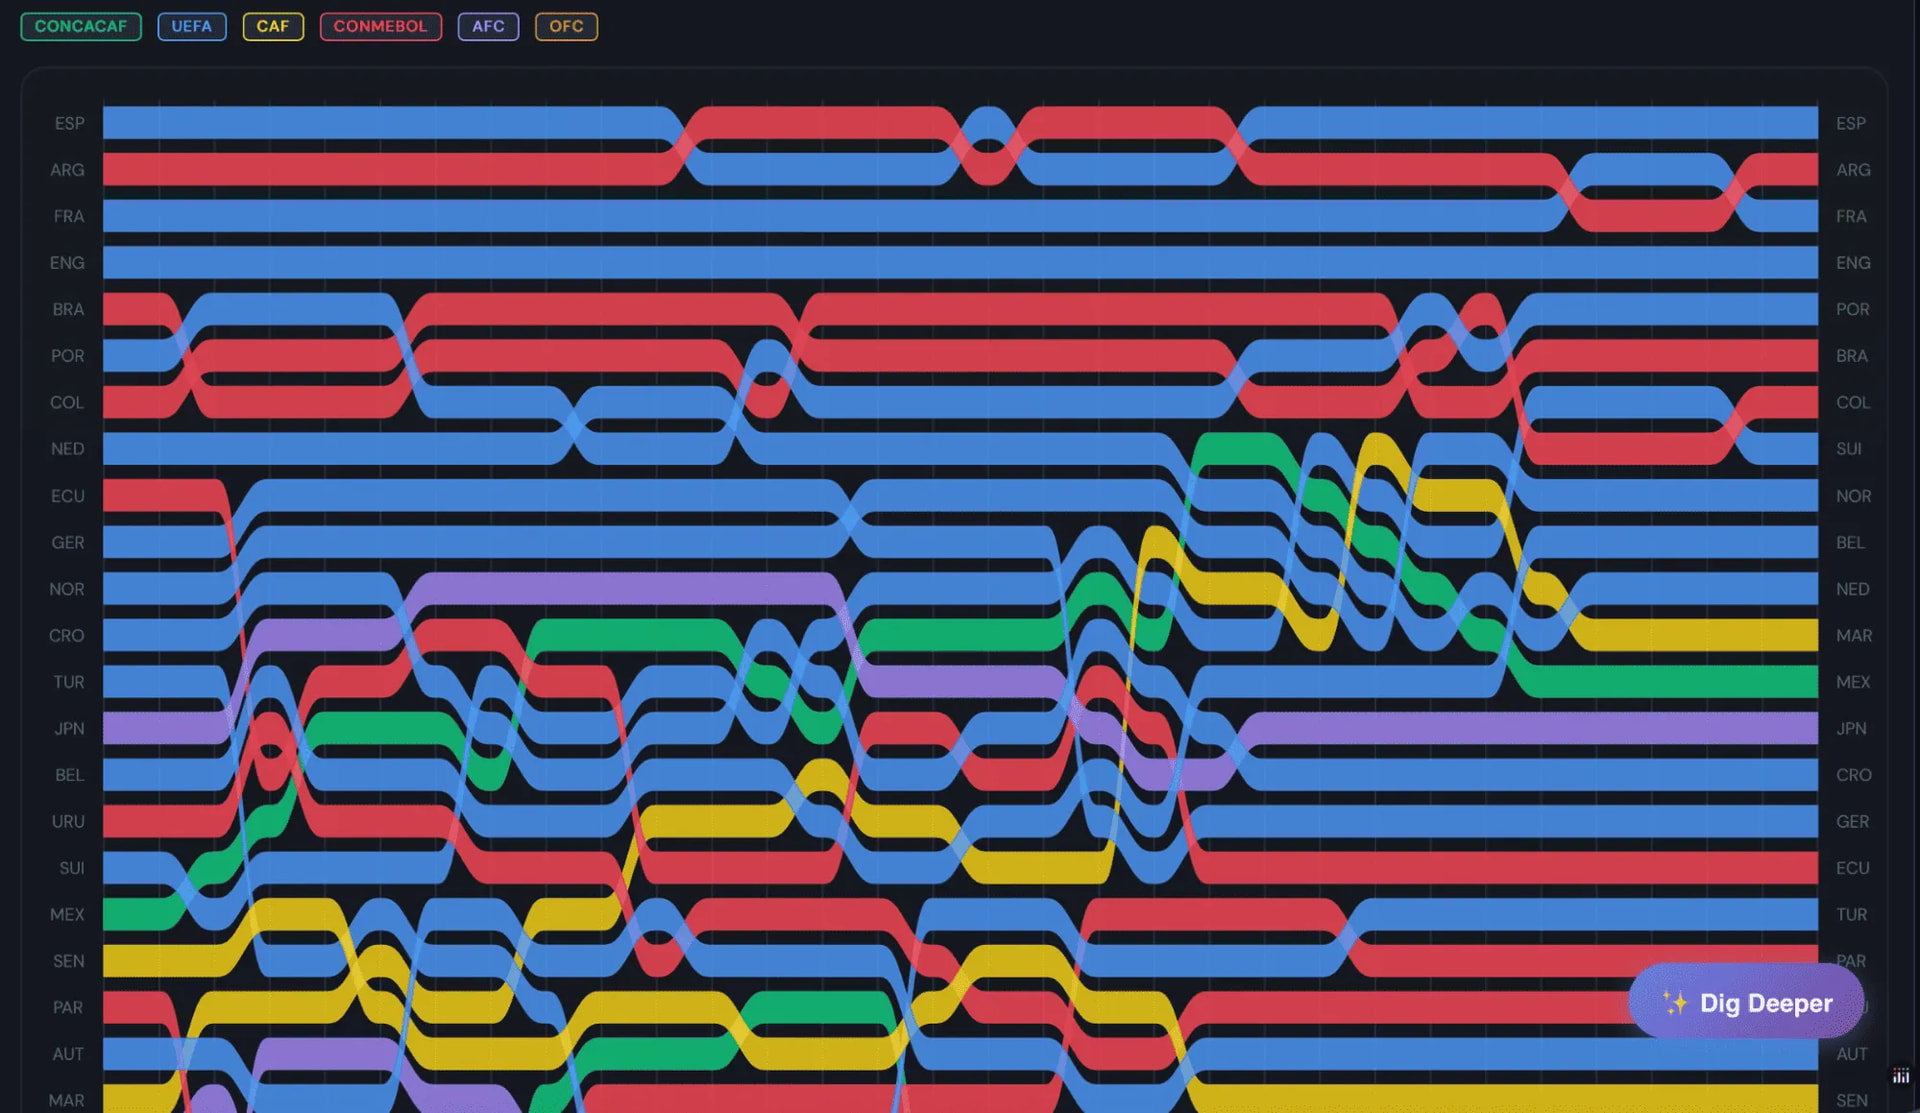
Love the dash-nivo library @PipInstallPython used it for the Elo Ratings rank chart

FIFA World Cup 2026 Live Dashboard

Live App: https://46b9166b-c9d4-4387-80f2-9d3a21b6cabf.plotly.app/

Code: GitHub - budescode/wc2026-dashboard · GitHub

About the App

A real-time, full-featured dashboard for the 2026 FIFA World Cup, spanning 48 teams across the United States, Canada, and Mexico. Built entirely with Dash Plotly and Dash Bootstrap Components, the app pulls live data from the football-data.org API and gives fans everything they need to follow the tournament as it happens.

Features

Group Standings: All 12 groups with live tables showing points, wins, draws, losses, goal difference, and recent form. Top-2 advancement highlighted in green.

Live Matches: Dedicated live page that auto-refreshes every 20 seconds. Shows real-time scores with pulsing live indicators for every match in progress.

Match Browser: All 104 fixtures organised by date. Click any match card to open a detail modal with full-time score, half-time score, head-to-head history, and referee information. Live match modals auto-refresh.

Golden Boot Race: Top scorers leaderboard with visual goal bars, assist counts, and penalty breakdown. Includes a full Plotly bar chart of the top 20 scorers.

Goals & Charts: Tournament-wide scoring analysis with dual-axis group goals chart (total goals + goals-per-match line), and a full Golden Boot leaderboard with medal rankings.

Knockout Bracket: Automatically populates with Round of 32, Round of 16, Quarter Finals, Semi Finals, and Final once the group stage ends.

Teams: Full squad rosters for all 48 teams, organised by position (GK / DEF / MID / FWD), with coach name, founding year, and group standing. Expandable accordion per team.

Fixtures: Complete schedule of all 104 matches with kickoff times in UTC.

Played Matches: Results and stats for every completed game, including goals scored, goals per match, clean sheets, home/away win ratio, and a visual W/D/L bar.

Light / Dark Theme: Toggle between light and dark mode. Preference is saved to localStorage and persists across sessions.

FIFA World Cup 2026 — Interactive Map Dashboard

A Dash app for following the World Cup 2026, built around an interactive map of the three host countries (USA, Mexico, Canada). 2026 is the first World Cup ever co-hosted by three nations across a continent-sized, multi-timezone geography. So the map leads, and every kickoff is auto-converted to the viewer’s own local timezone.

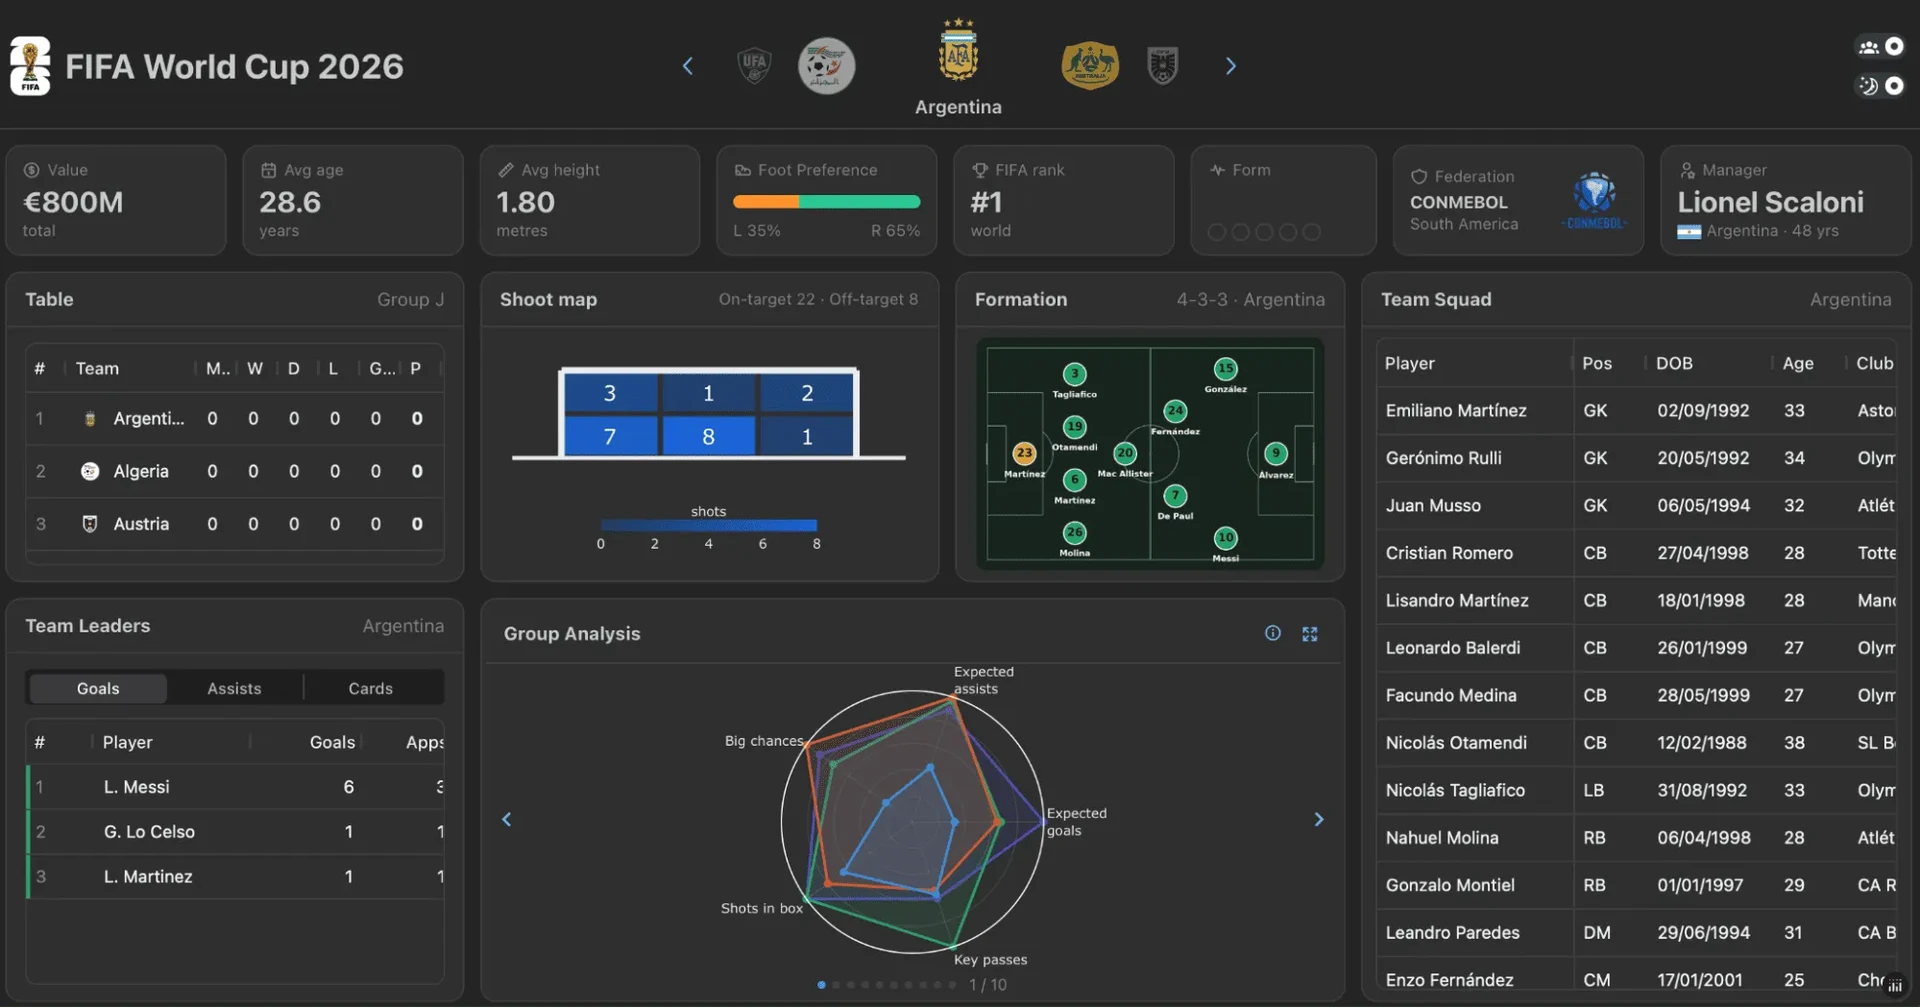
It runs in two modes: a Time mode calendar that highlights the venues hosting a match on the selected date, shows live scores on the map, and lists that day’s fixtures; and a Team mode dashboard with squads, formations, group tables, leaders, and travel maps for all 48 teams. Live data comes from the Highlightly API over a persistent Dash WebSocket; it falls back gracefully to bundled data with no key.

Styled after a timeless World Cup Panini sticker book; built to be explored, not just skimmed. From the host venues and the cities they sit in, down to deep detail on every qualified nation: full squads, estimated formations, the managers behind them, and the stats that bring each team to life. Feel free to dig deep and poke around! There are plenty of hidden features to discover.

App: https://2009d9a9-b474-4f5e-9306-0d09ab72df80.plotly.app/
Code: GitHub - ytalp17/worldcup-2026-dashboard · GitHub
LinkedIn post: Sign in | Yigitalp Berber

Note: this isn’t the planned finished version — the app will be actively developed and maintained through June 30.

Kept tinkering with my FIFA World Cup 2026 dashboard since the last post.

Better mobile experience — built for those mornings when you wake up and want to see what happened overnight without sitting at a desk.

Also added a new page to the Elo Intelligence section:

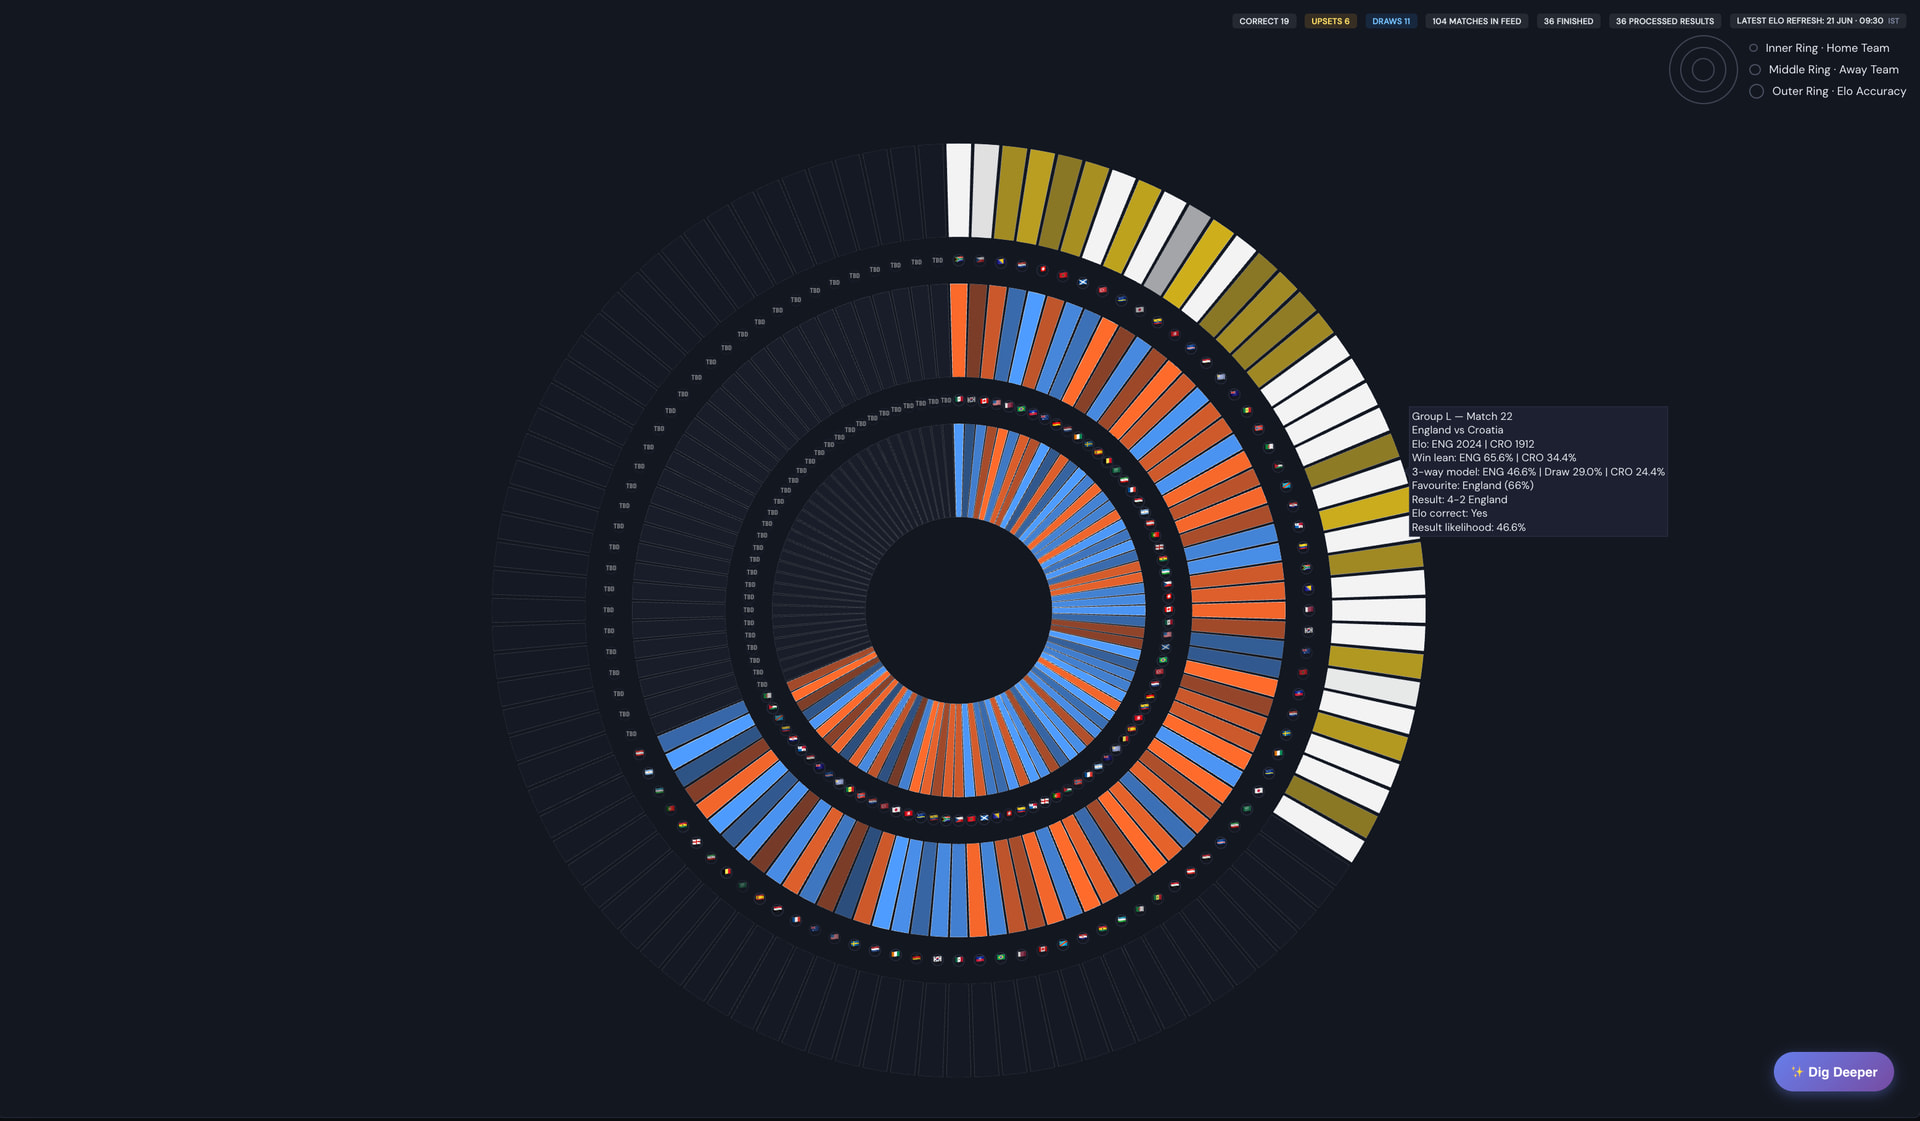
  • Elo Ranking Shifts by Tournament Day — how every team’s global rank has moved since matchday 1
  • Elo Rating Movement by Match — before and after ratings for every team across every fixture
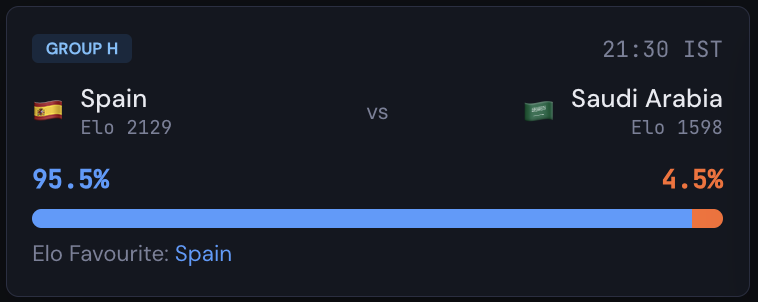
  • Elo Win Probabilities Across All Fixtures — upcoming match predictions with home and away win probabilities. And yes, if you know me, you know I had to put a circular visualisation in there.

Live app: https://164208b3-4aa9-46fb-b858-02bf7b78b4db.plotly.app/

@adamschroeder

World Cup 2026 Dashboard, what’s new

A quick update on the interactive World Cup 2026 map dashboard I shared earlier. It has grown a lot since then, and the biggest addition makes everything easier to find.

A guided walkthrough. Tap the glowing light bulb and the app gives you a spotlight tour. It dims the screen and highlights each feature in turn, from the host-country map and the matchday calendar to every control and the full Team-mode dashboard, even switching modes for you as it goes. First-time visitors get a gentle nudge to start it, and the active panel always glows so you never lose your place.

And since I last posted, the analytics under the hood went deeper:

Shoot map. Where each team takes its shots across the goal mouth. Click any zone to see every shot from that spot.

Deep Analysis. Radar and race charts that compare every team in a group, side by side.

Knockout bracket. Follow the road to the final, stage by stage.

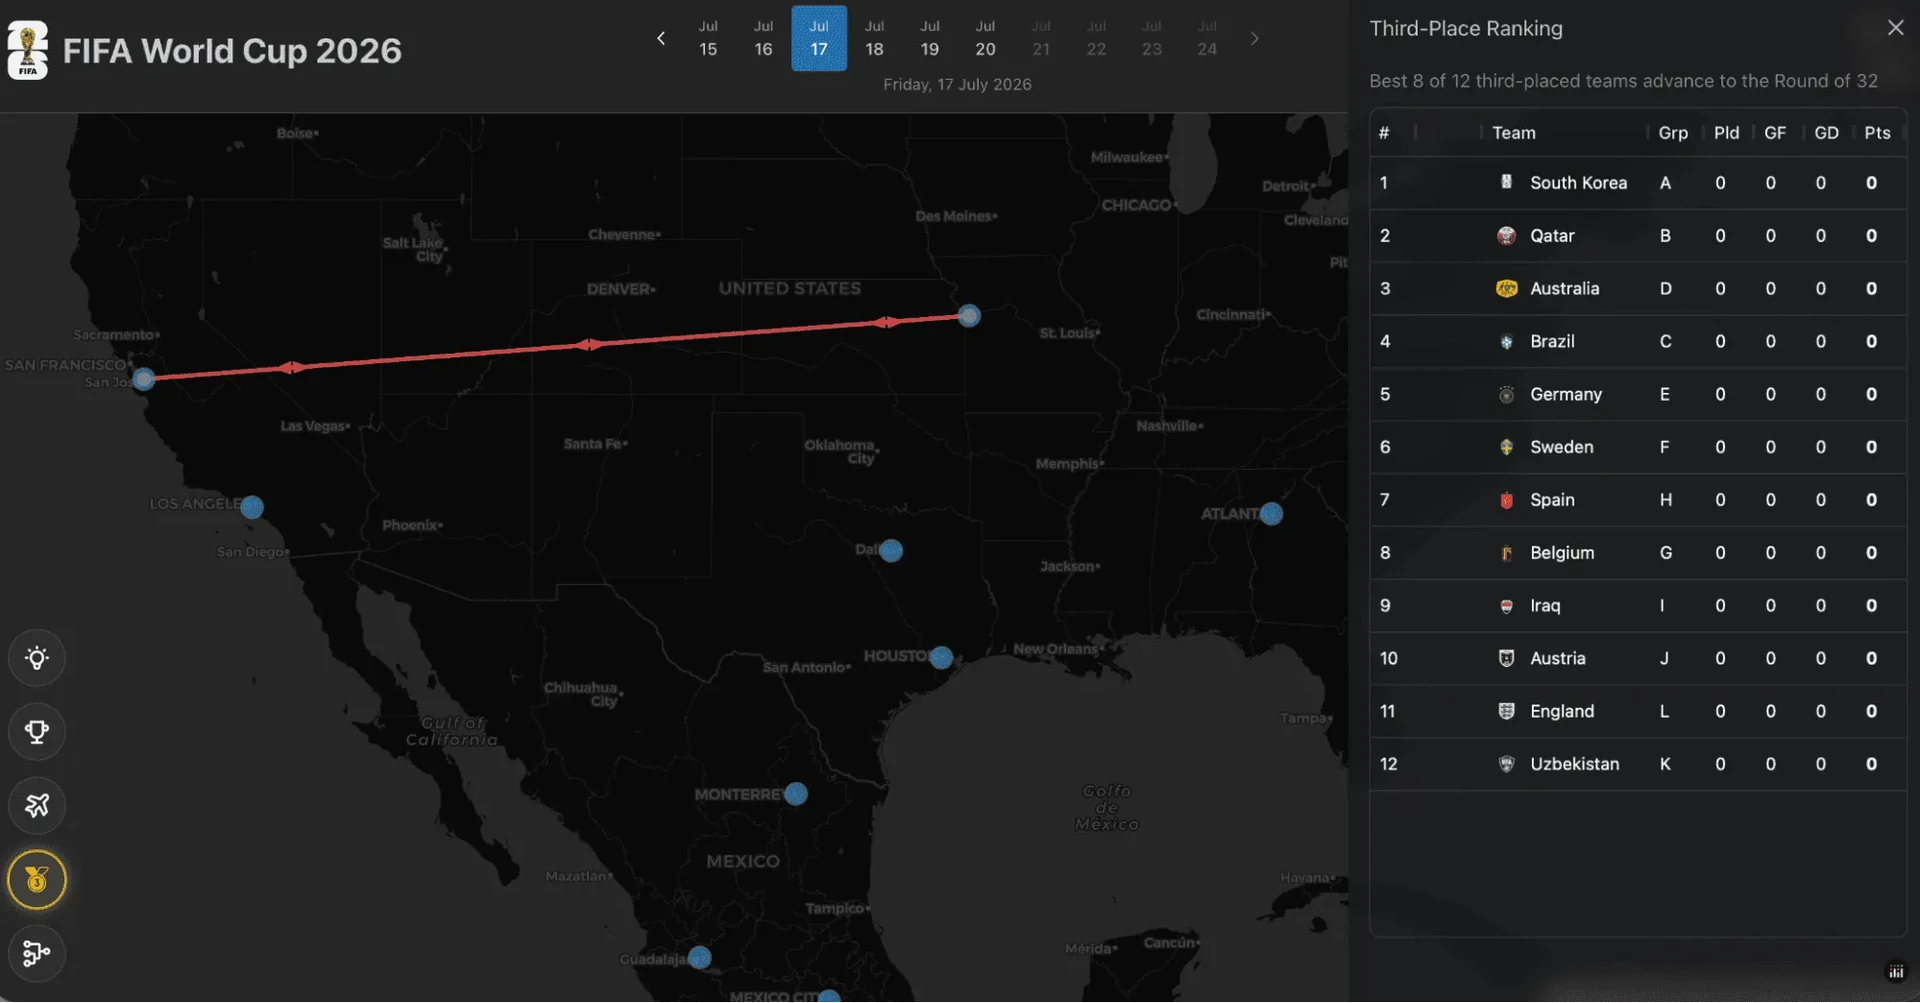
Third-place race. The ranking that decides which group runners-up advance.

Still styled like a timeless Panini sticker book, still auto-converting every kickoff to your own local timezone, and still running on live Highlightly data over a persistent WebSocket, with a graceful fallback to bundled data when there is no key.

Take the tour, then dig in.

You can use the same app link I shared earlier, and the GitHub page is updated accordingly.

:soccer_ball: STATDIUM just got a serious upgrade - and it hits different now. :fire:

Since the initial drop, I’ve been heads-down rebuilding, refining, and pushing the app to a level I’m genuinely proud of. Here’s what changed:

:dna: New Pages & Features:

:bullseye: Match Predictor - Pick winners for every fixture. Your accuracy tracked live vs the Elo model baseline. Can you beat the algorithm?

:crystal_ball: What If Scenario Builder - Override any match score. Watch all 12 group standings recompute in real time. “What if Germany lost to Curaçao?” - now you can find out.

:dna: Tactical DNA - Every team gets a unique geometric fingerprint generated from their live stats. No two look the same. Data as art.

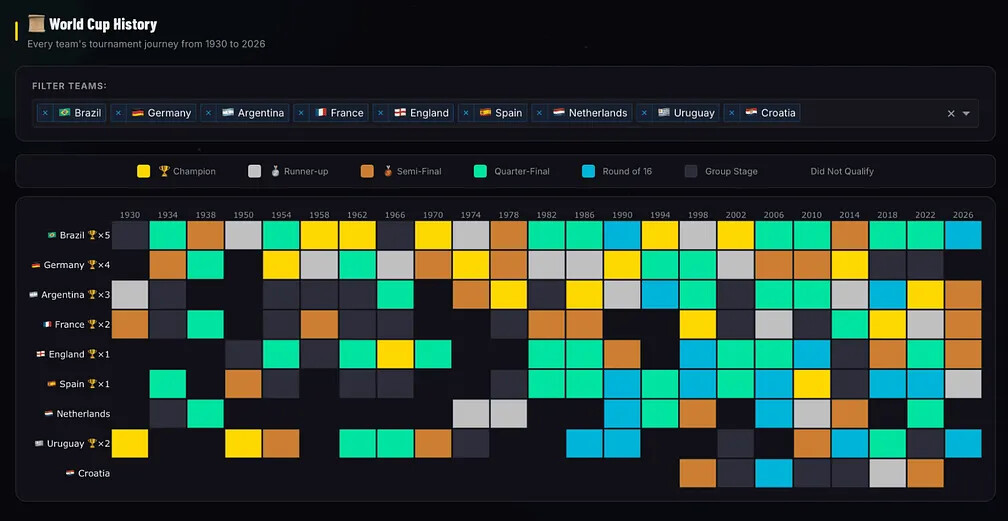
:scroll: Historical Heatmap - Every World Cup from 1930 to 2022. Every team. Every result. 92 years of football in one chart.

:green_heart: Fan Pulse World Map - Countries coloured by a composite performance score. Watch the map shift as the tournament unfolds.

:money_bag: GDP vs Football Power - Does money buy World Cup success? Spoiler: not really.

:clapper_board: Tournament Simulator - Animate a full bracket round by round. Run it again. See variance. Embrace chaos.

:crossed_swords: H2H History - All-time head-to-head records between any two nations. Win bars, goals, everything.

:stadium: Stadium Clock Wall - All 16 host cities. Local time, live temperature, next match. Like a trading floor but make it football.
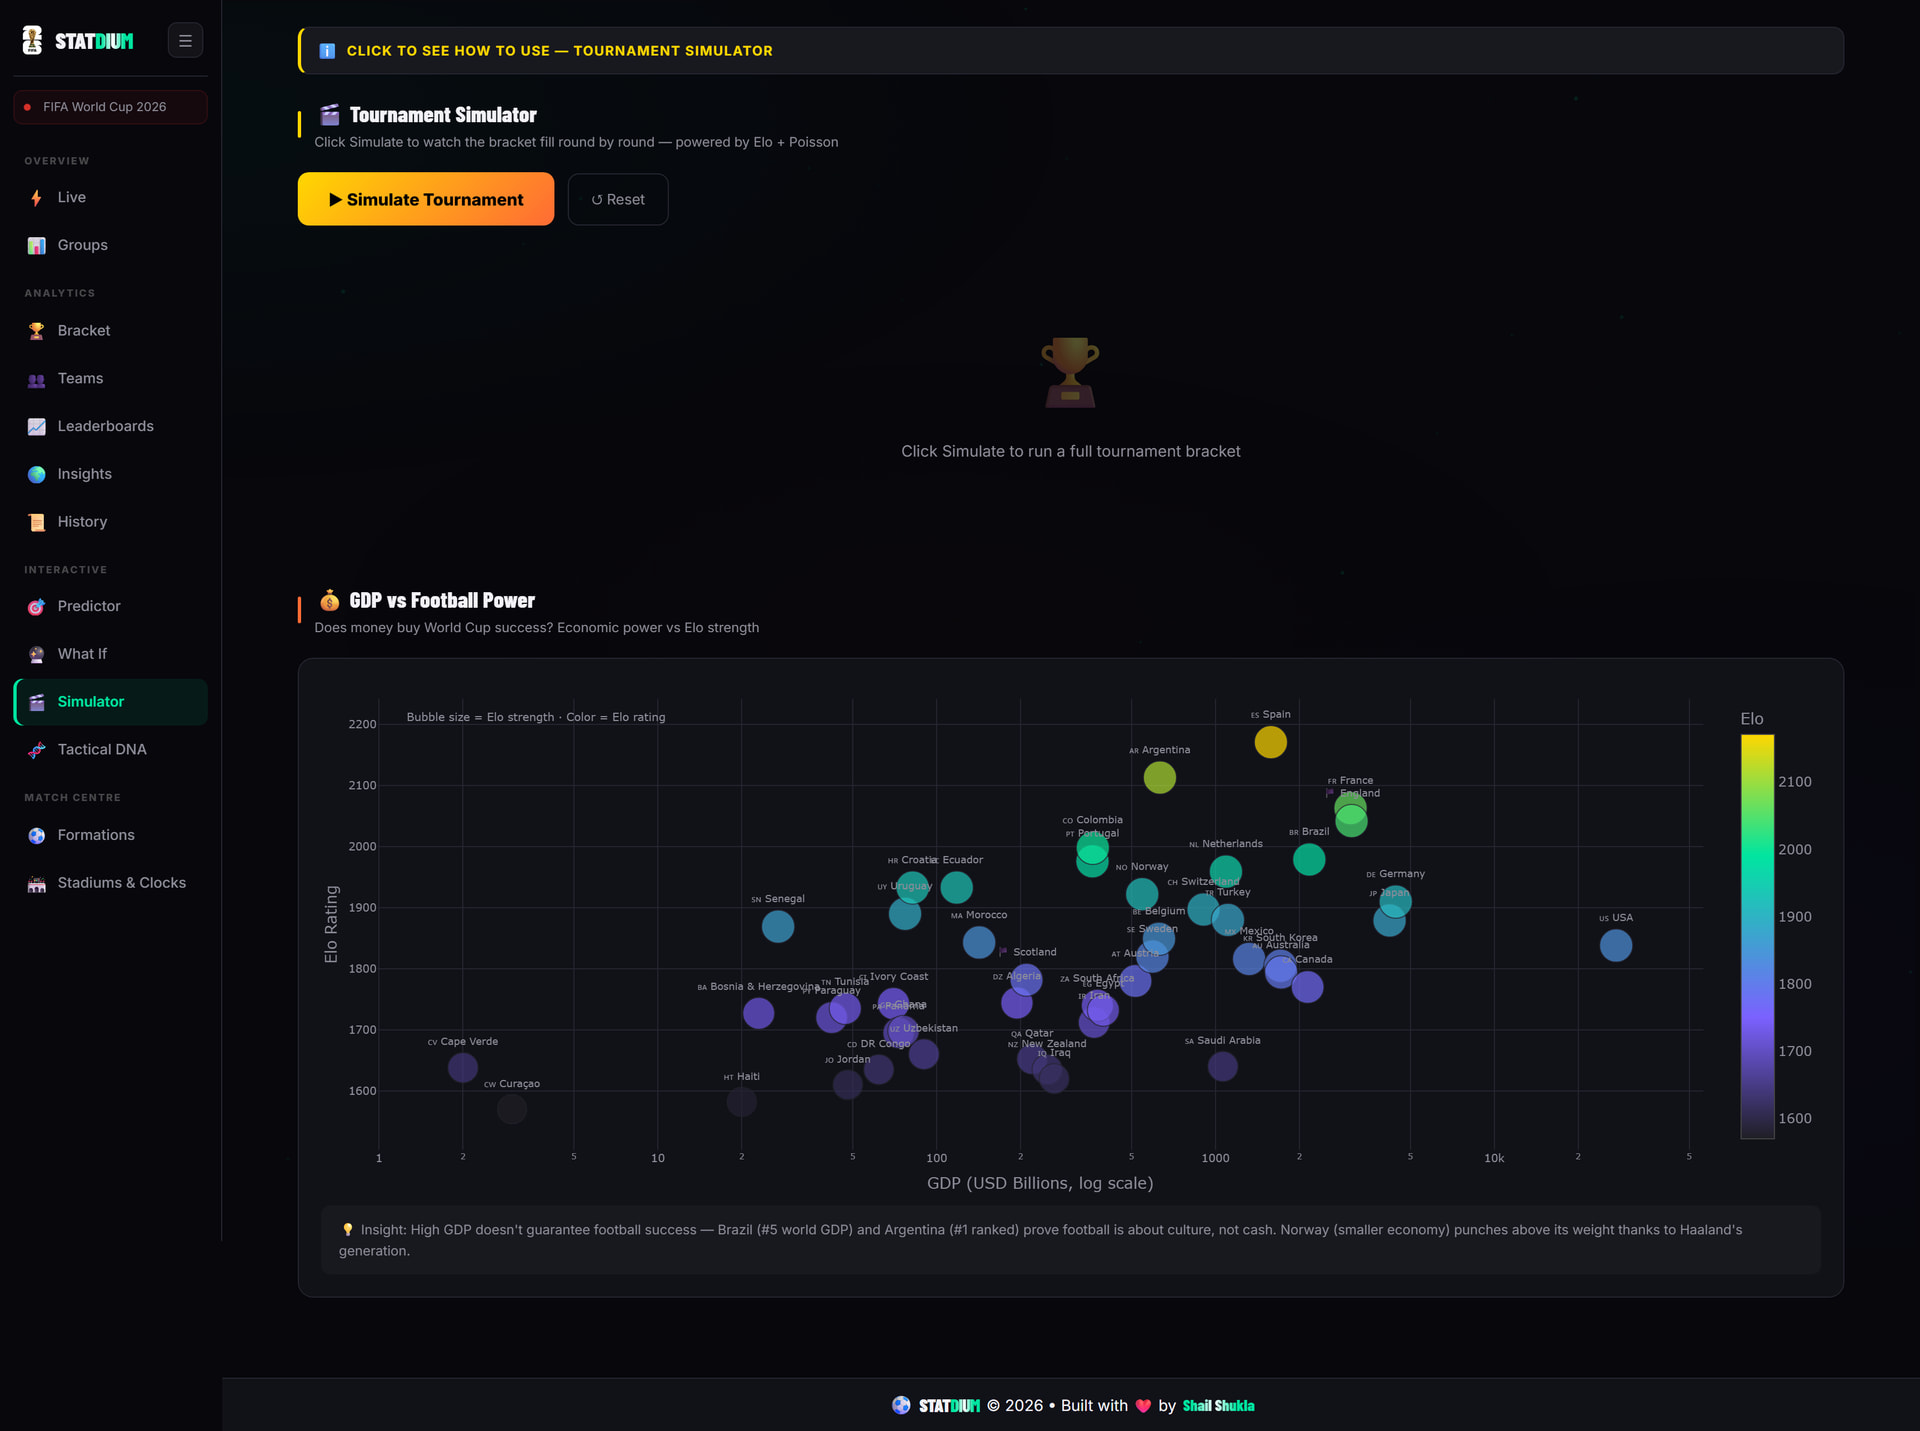
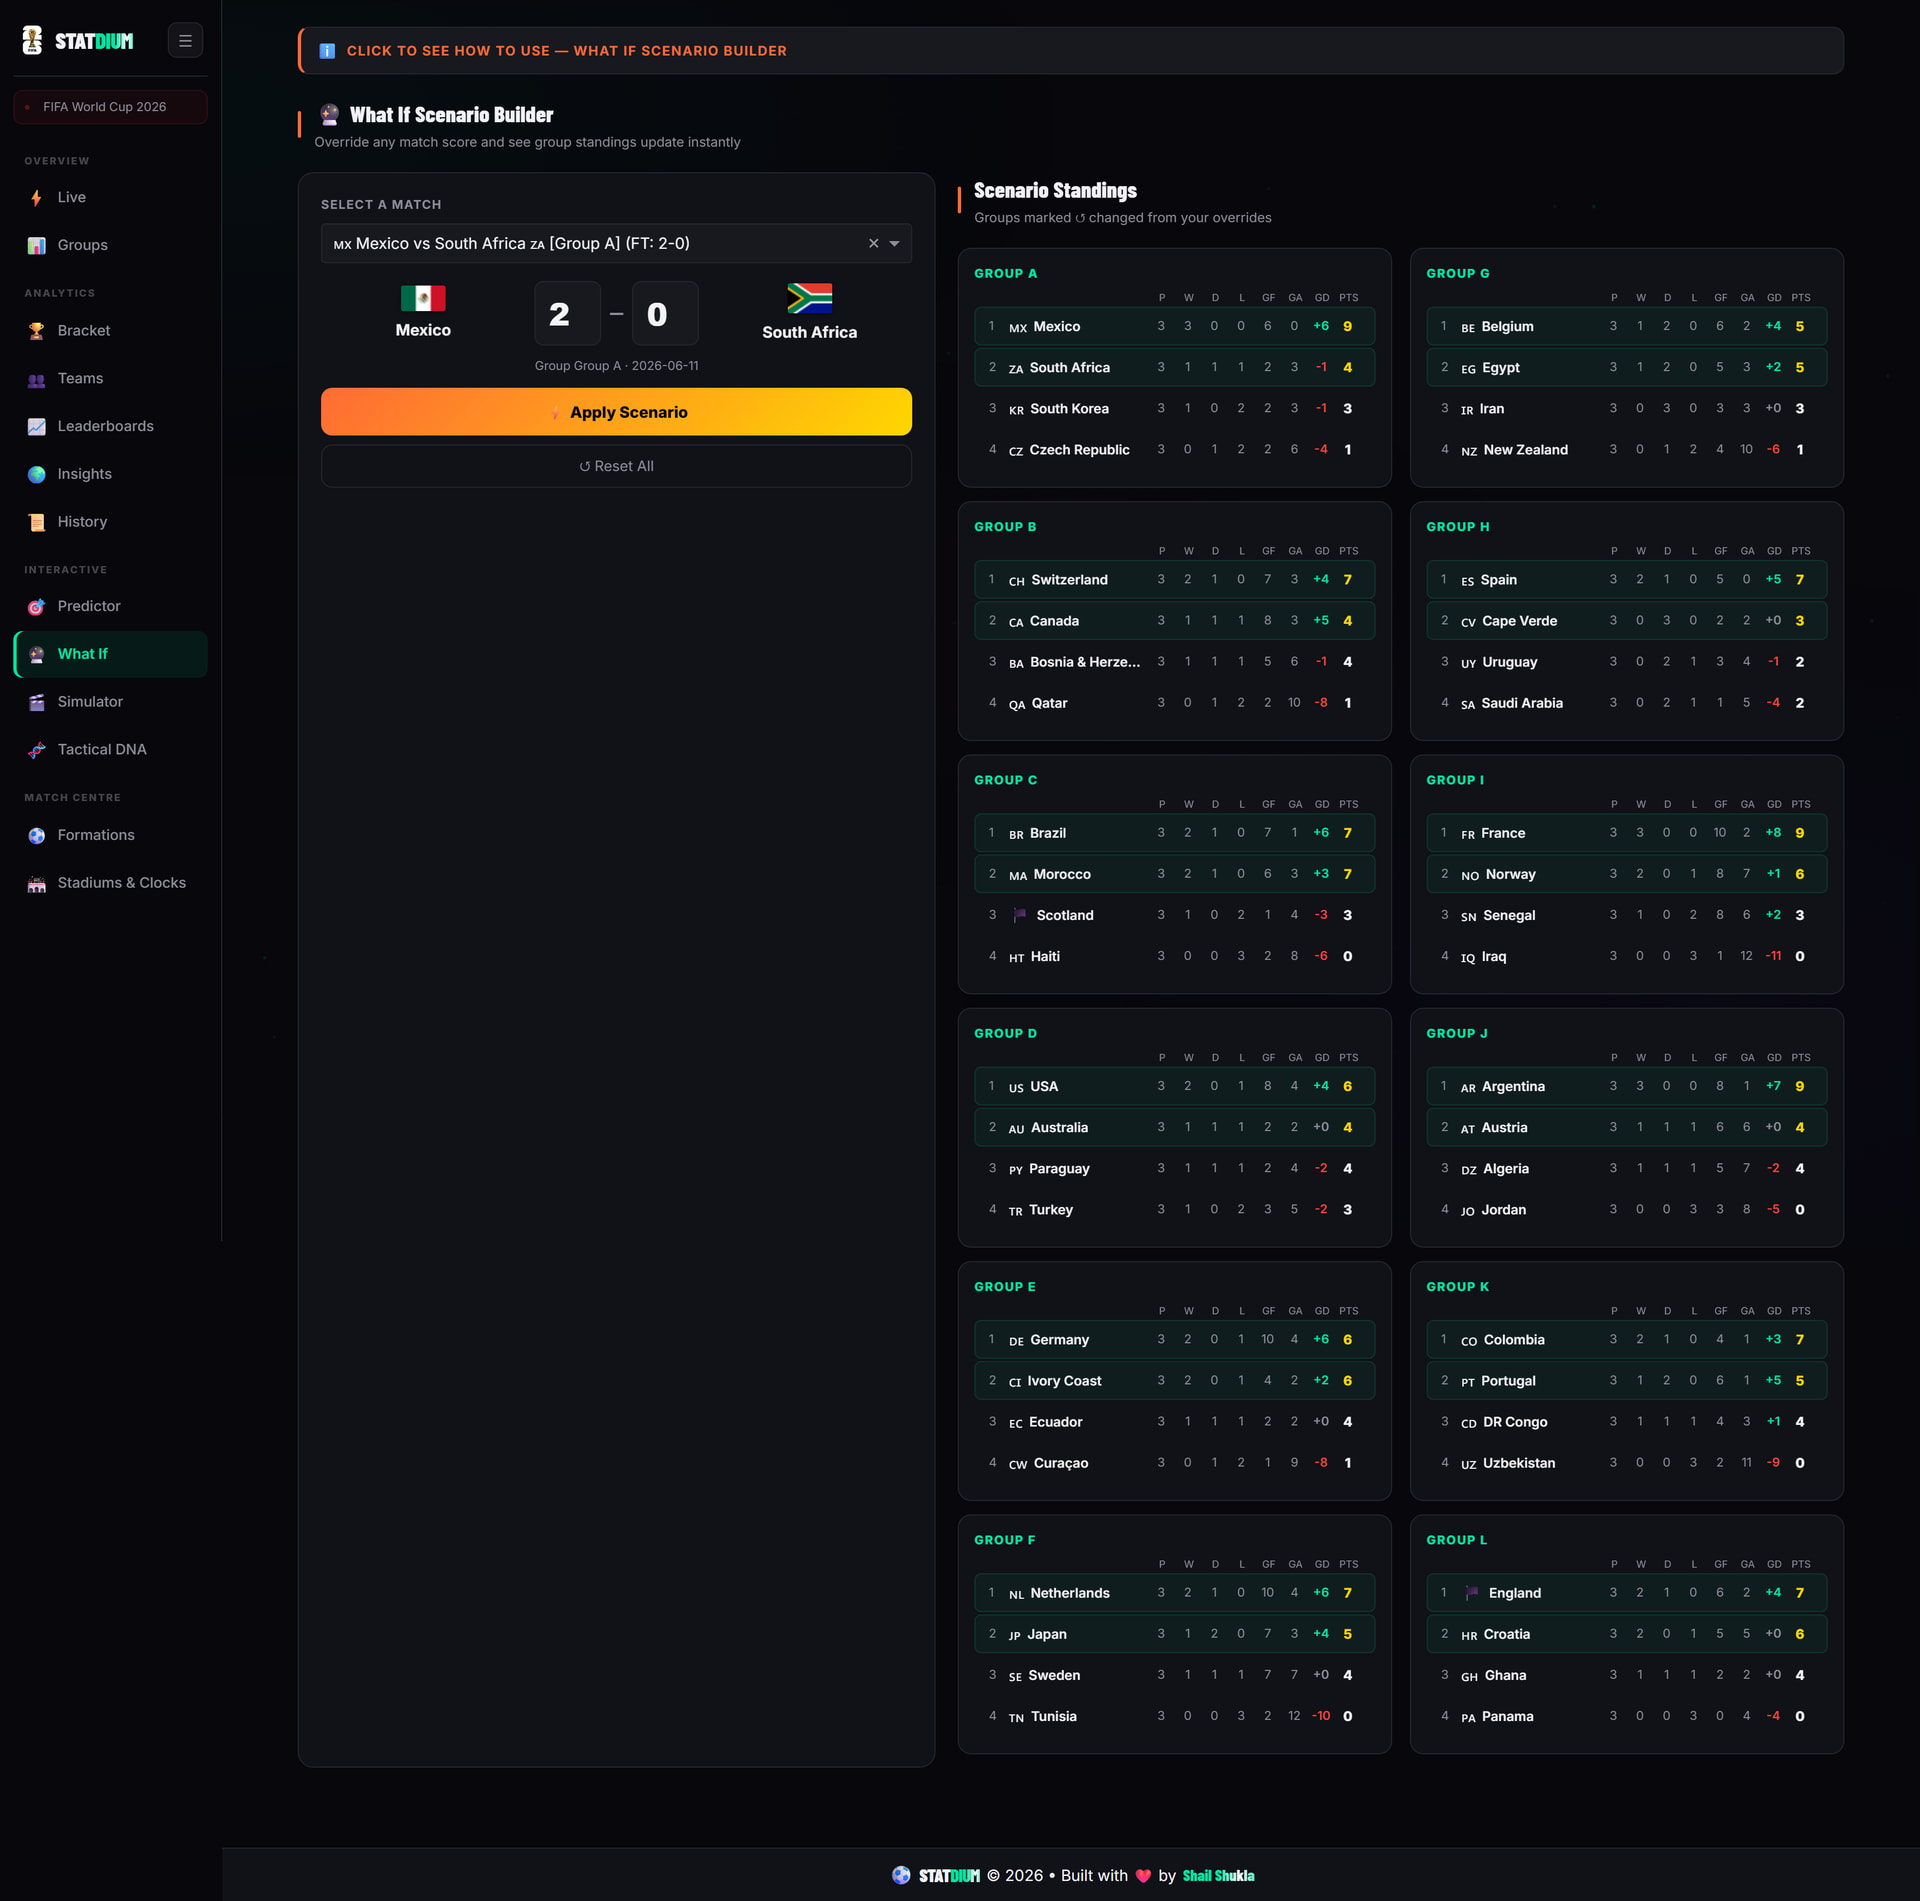
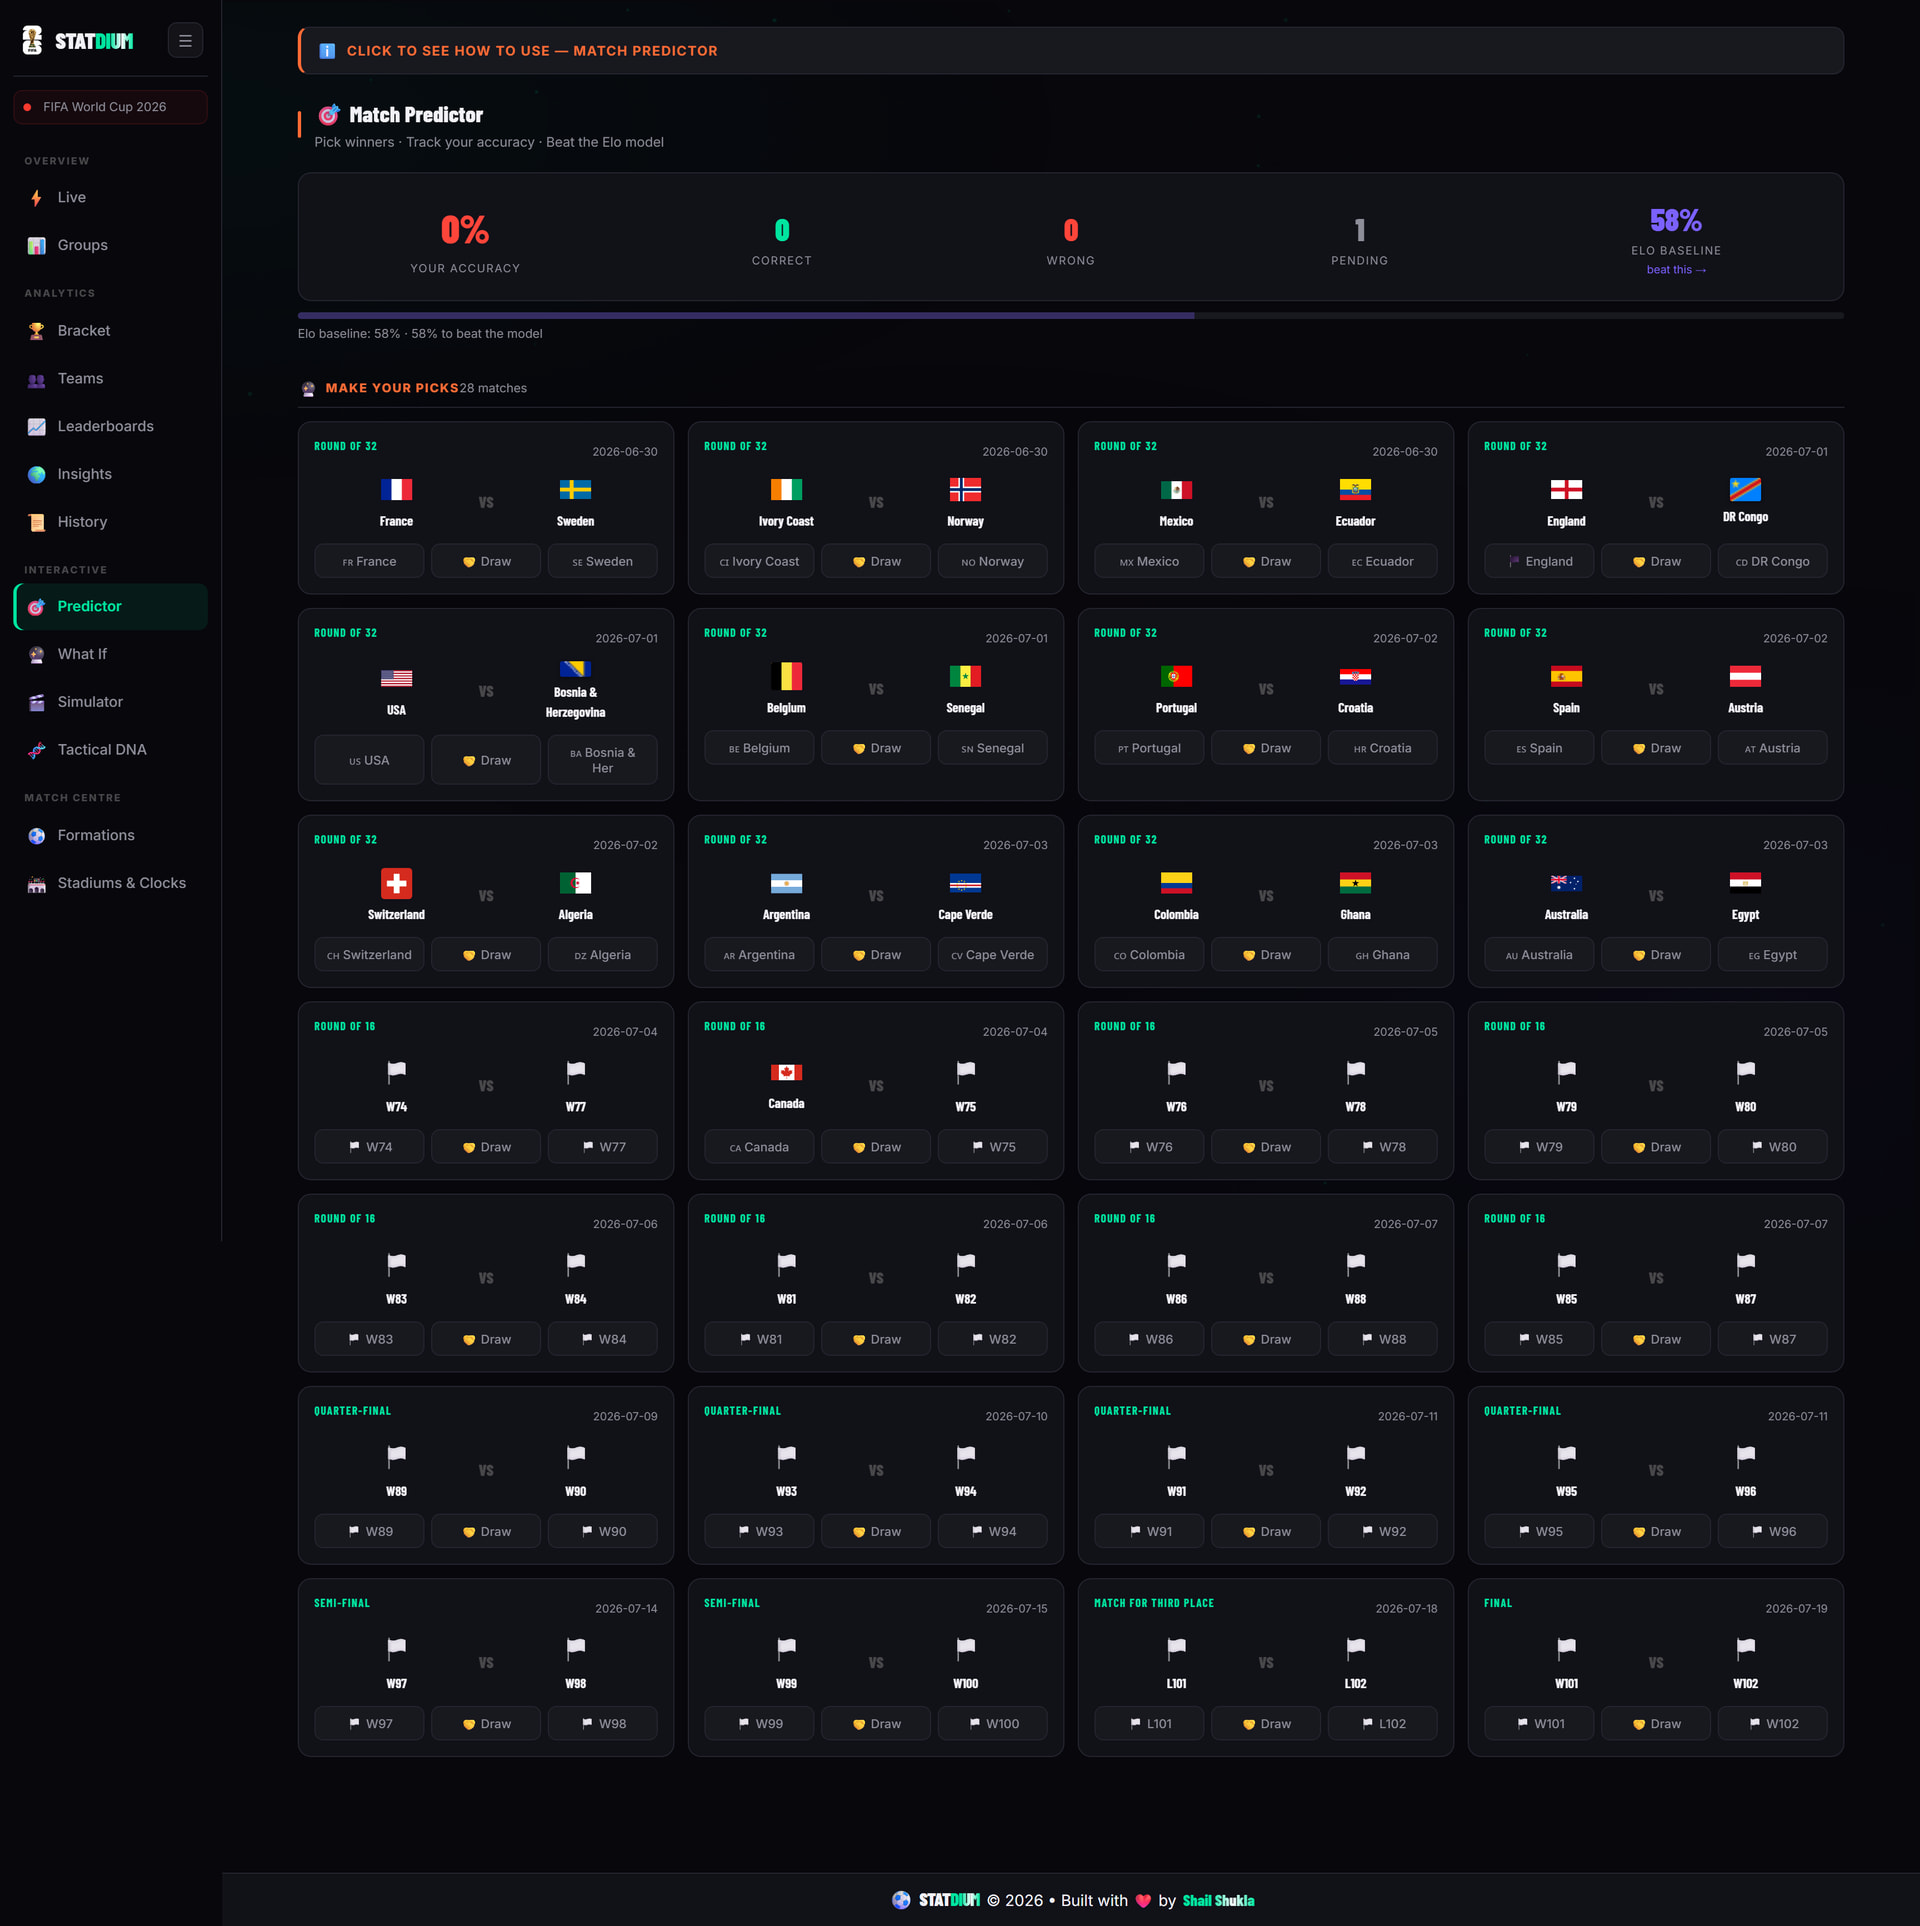
This started as a Plotly Dash App Challenge entry. It became something I actually want to use to follow the FIFA World Cup 2026™ - Canada, Mexico and the United States.

Still live. Still free. Still zero paywalls.

Check it out and let me know your views:

App → https://statdium-fifa-world-cup-2026.onrender.com/

GitHub → GitHub - Shail-1799/STATDIUM · GitHub

LinkedIn → #statdium #dataviz #plotly #dash #python #fifa2026 #football #dataanalytics #python #live #webapp #datafam #opensource | Shail Shukla

Adam Schroeder, @jinnyzor

Adam, I really tried to solve my deployment issue on Plotly Cloud with Nathan Drezner but no luck so far!

Please consider the app deployed on Render as my official submission. I hope that would still be valid.

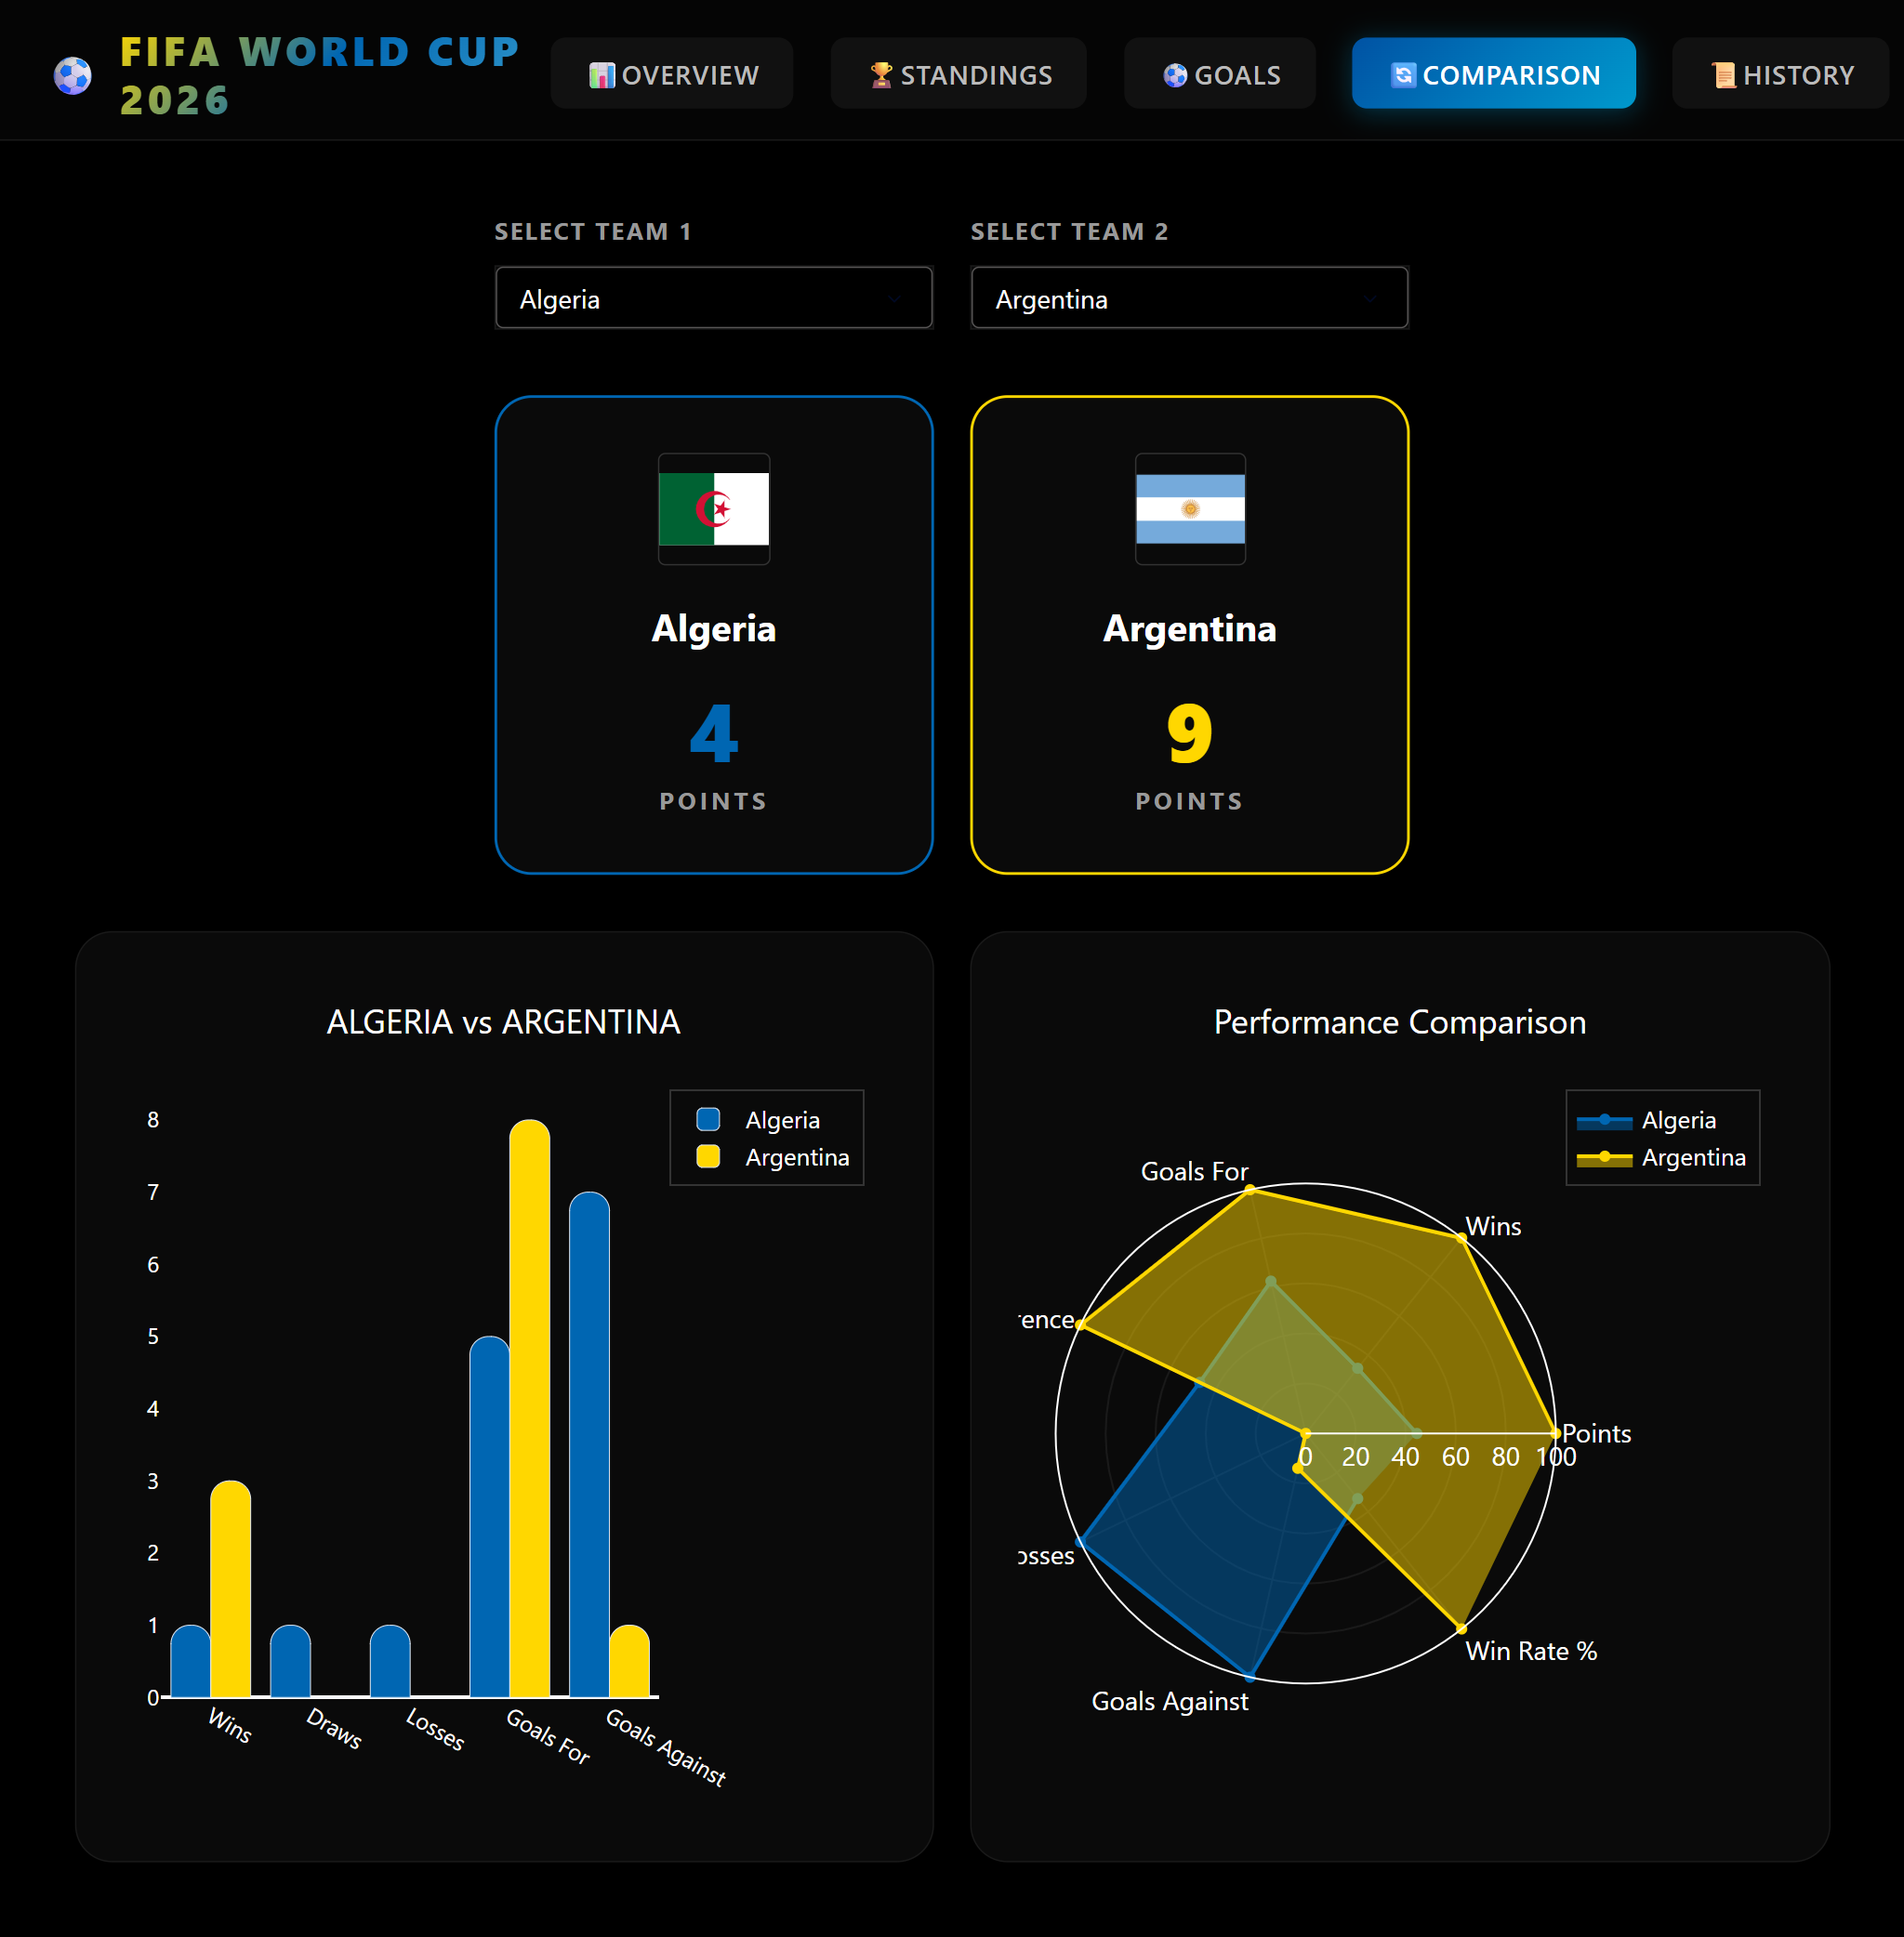
FIFA World Cup 2026 Dashboard — Final dashboard Summary

A Plotly Dash web application providing a live, interactive view of the FIFA World Cup 2026 tournament, built with a dark, FIFA-blue/gold themed UI and real-time data from the football-data.org API.

Six pages, navigable from a sticky, right-aligned top navbar (with a mobile hamburger menu):

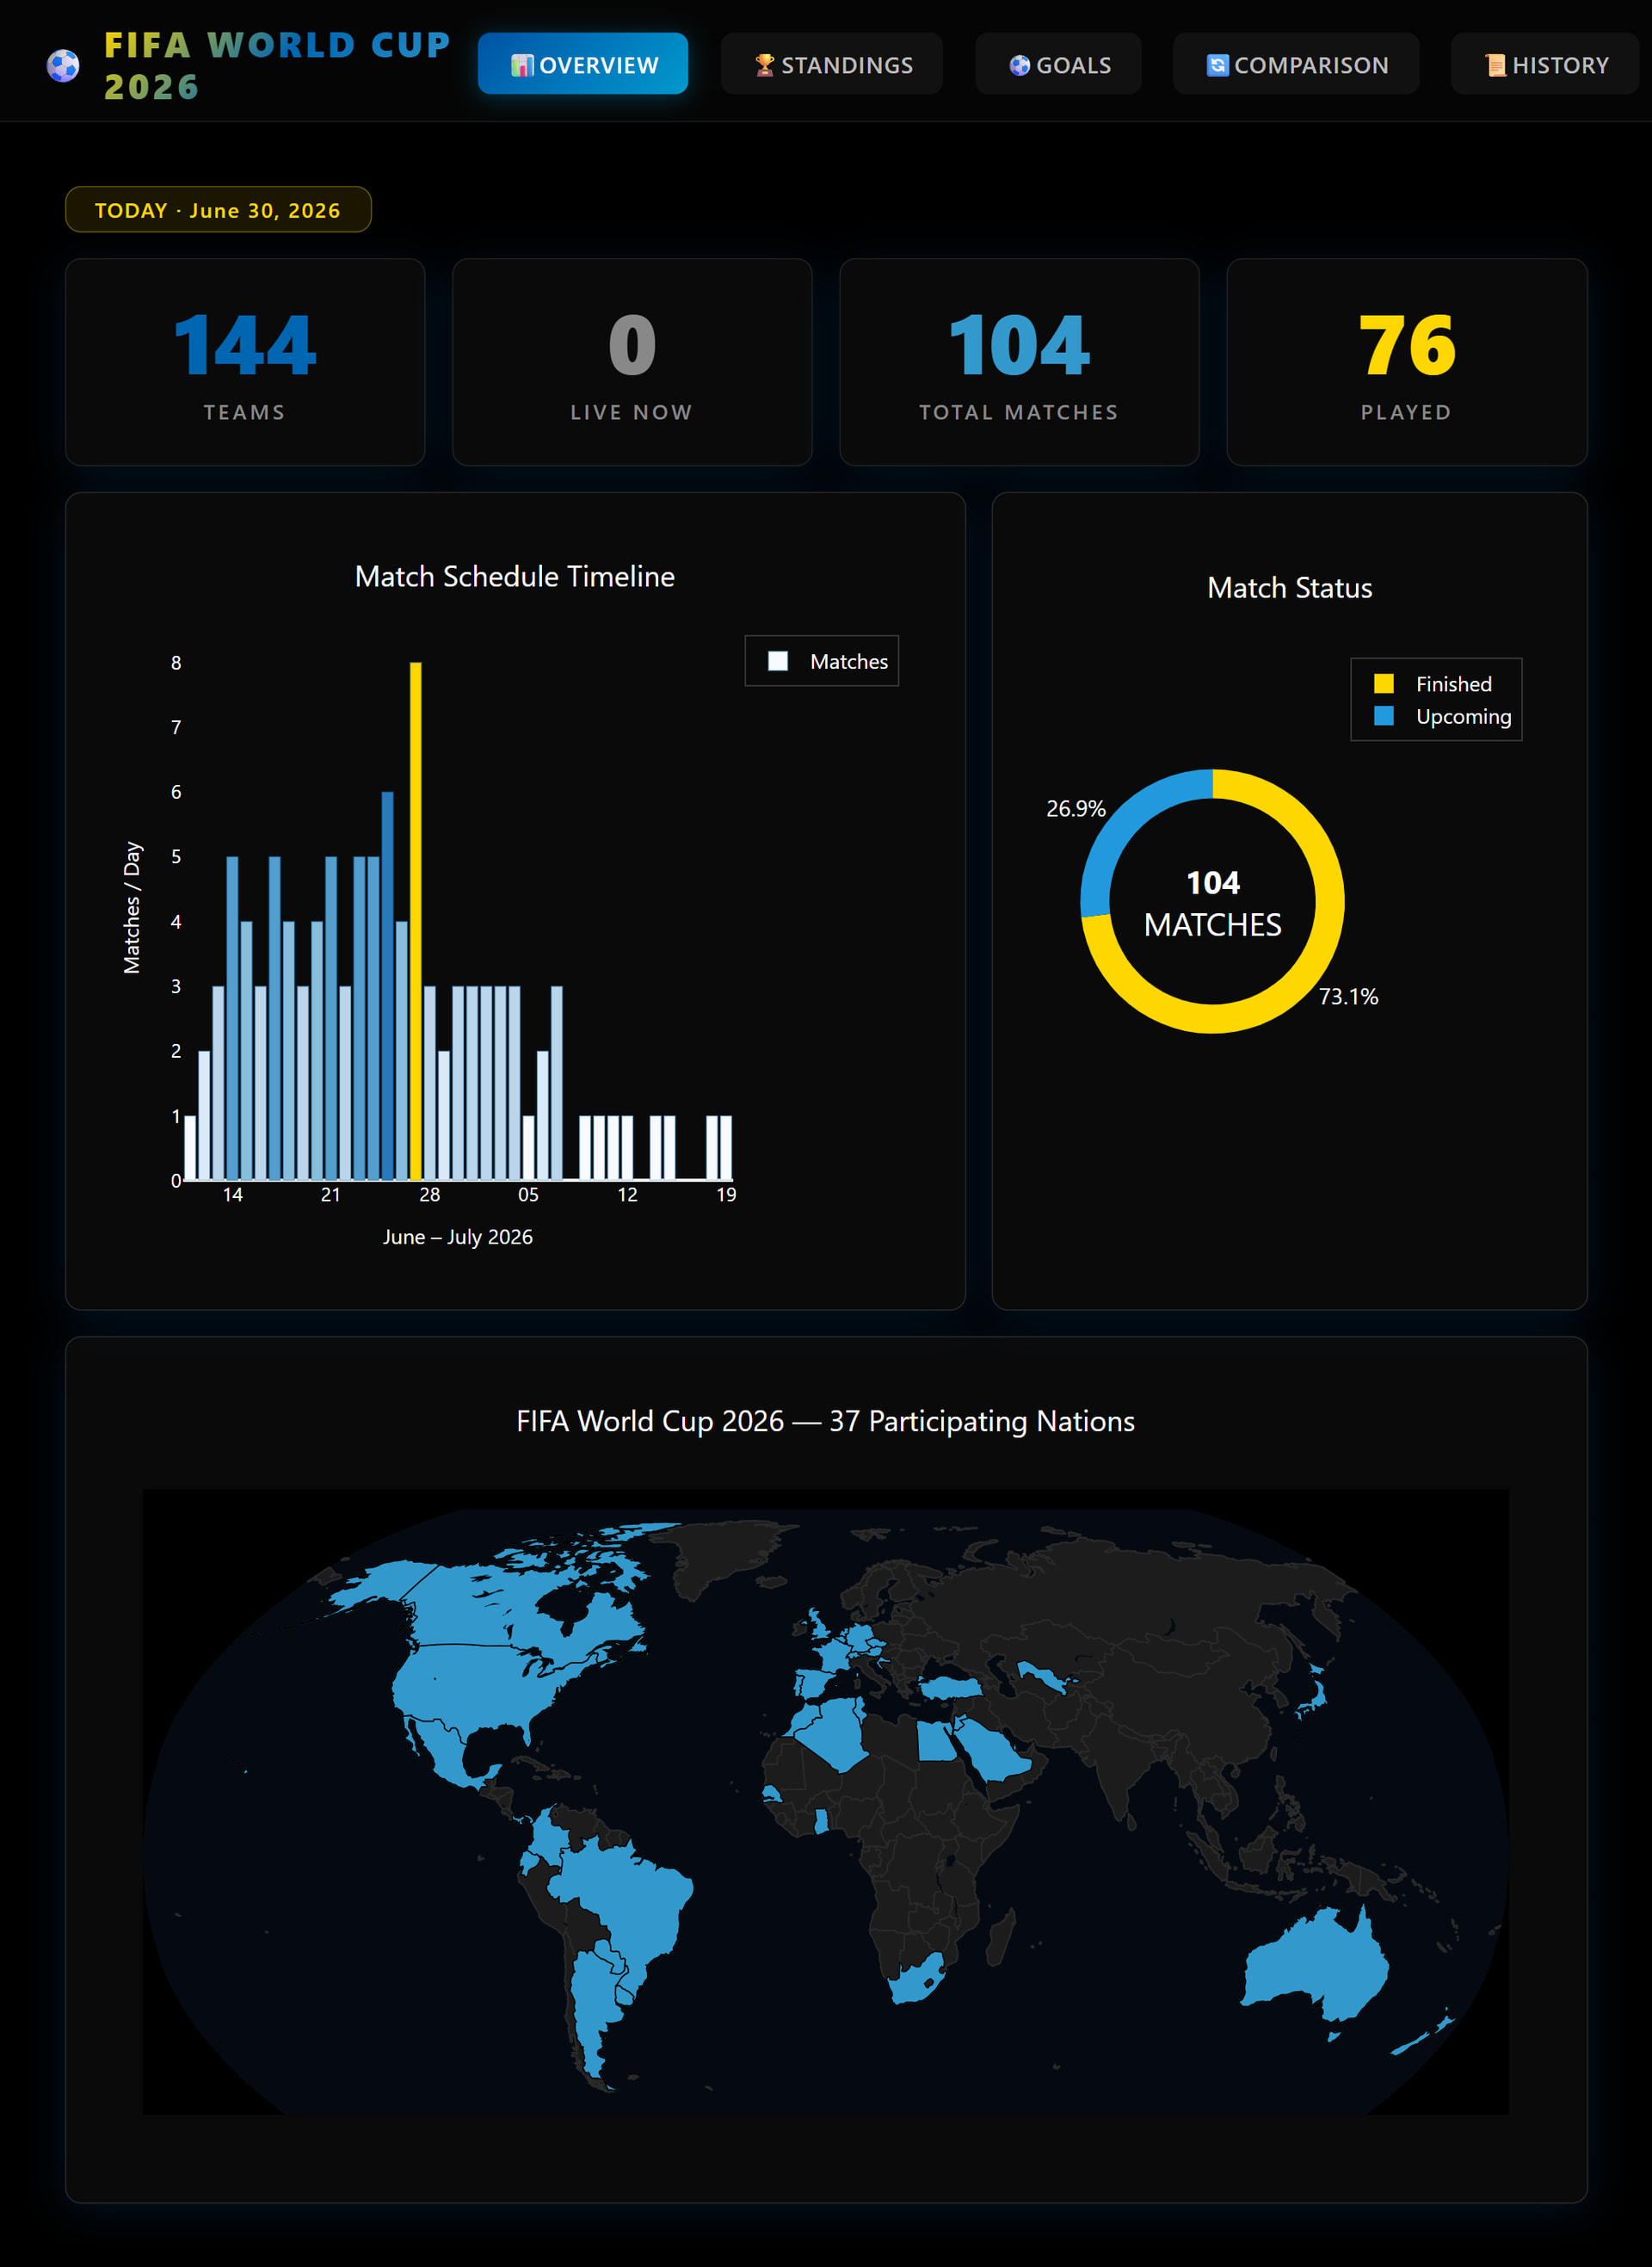
  • Overview — at-a-glance KPI cards (Teams, Live Now, Total Matches, Played), a match-schedule bar chart with a match-status donut chart, and a world choropleth map highlighting all participating nations.
  • Standings — per-group tables with medal-colored positions, win/draw/loss mini-bars, and a qualification marker, plus a match list toggling between Upcoming and Results.
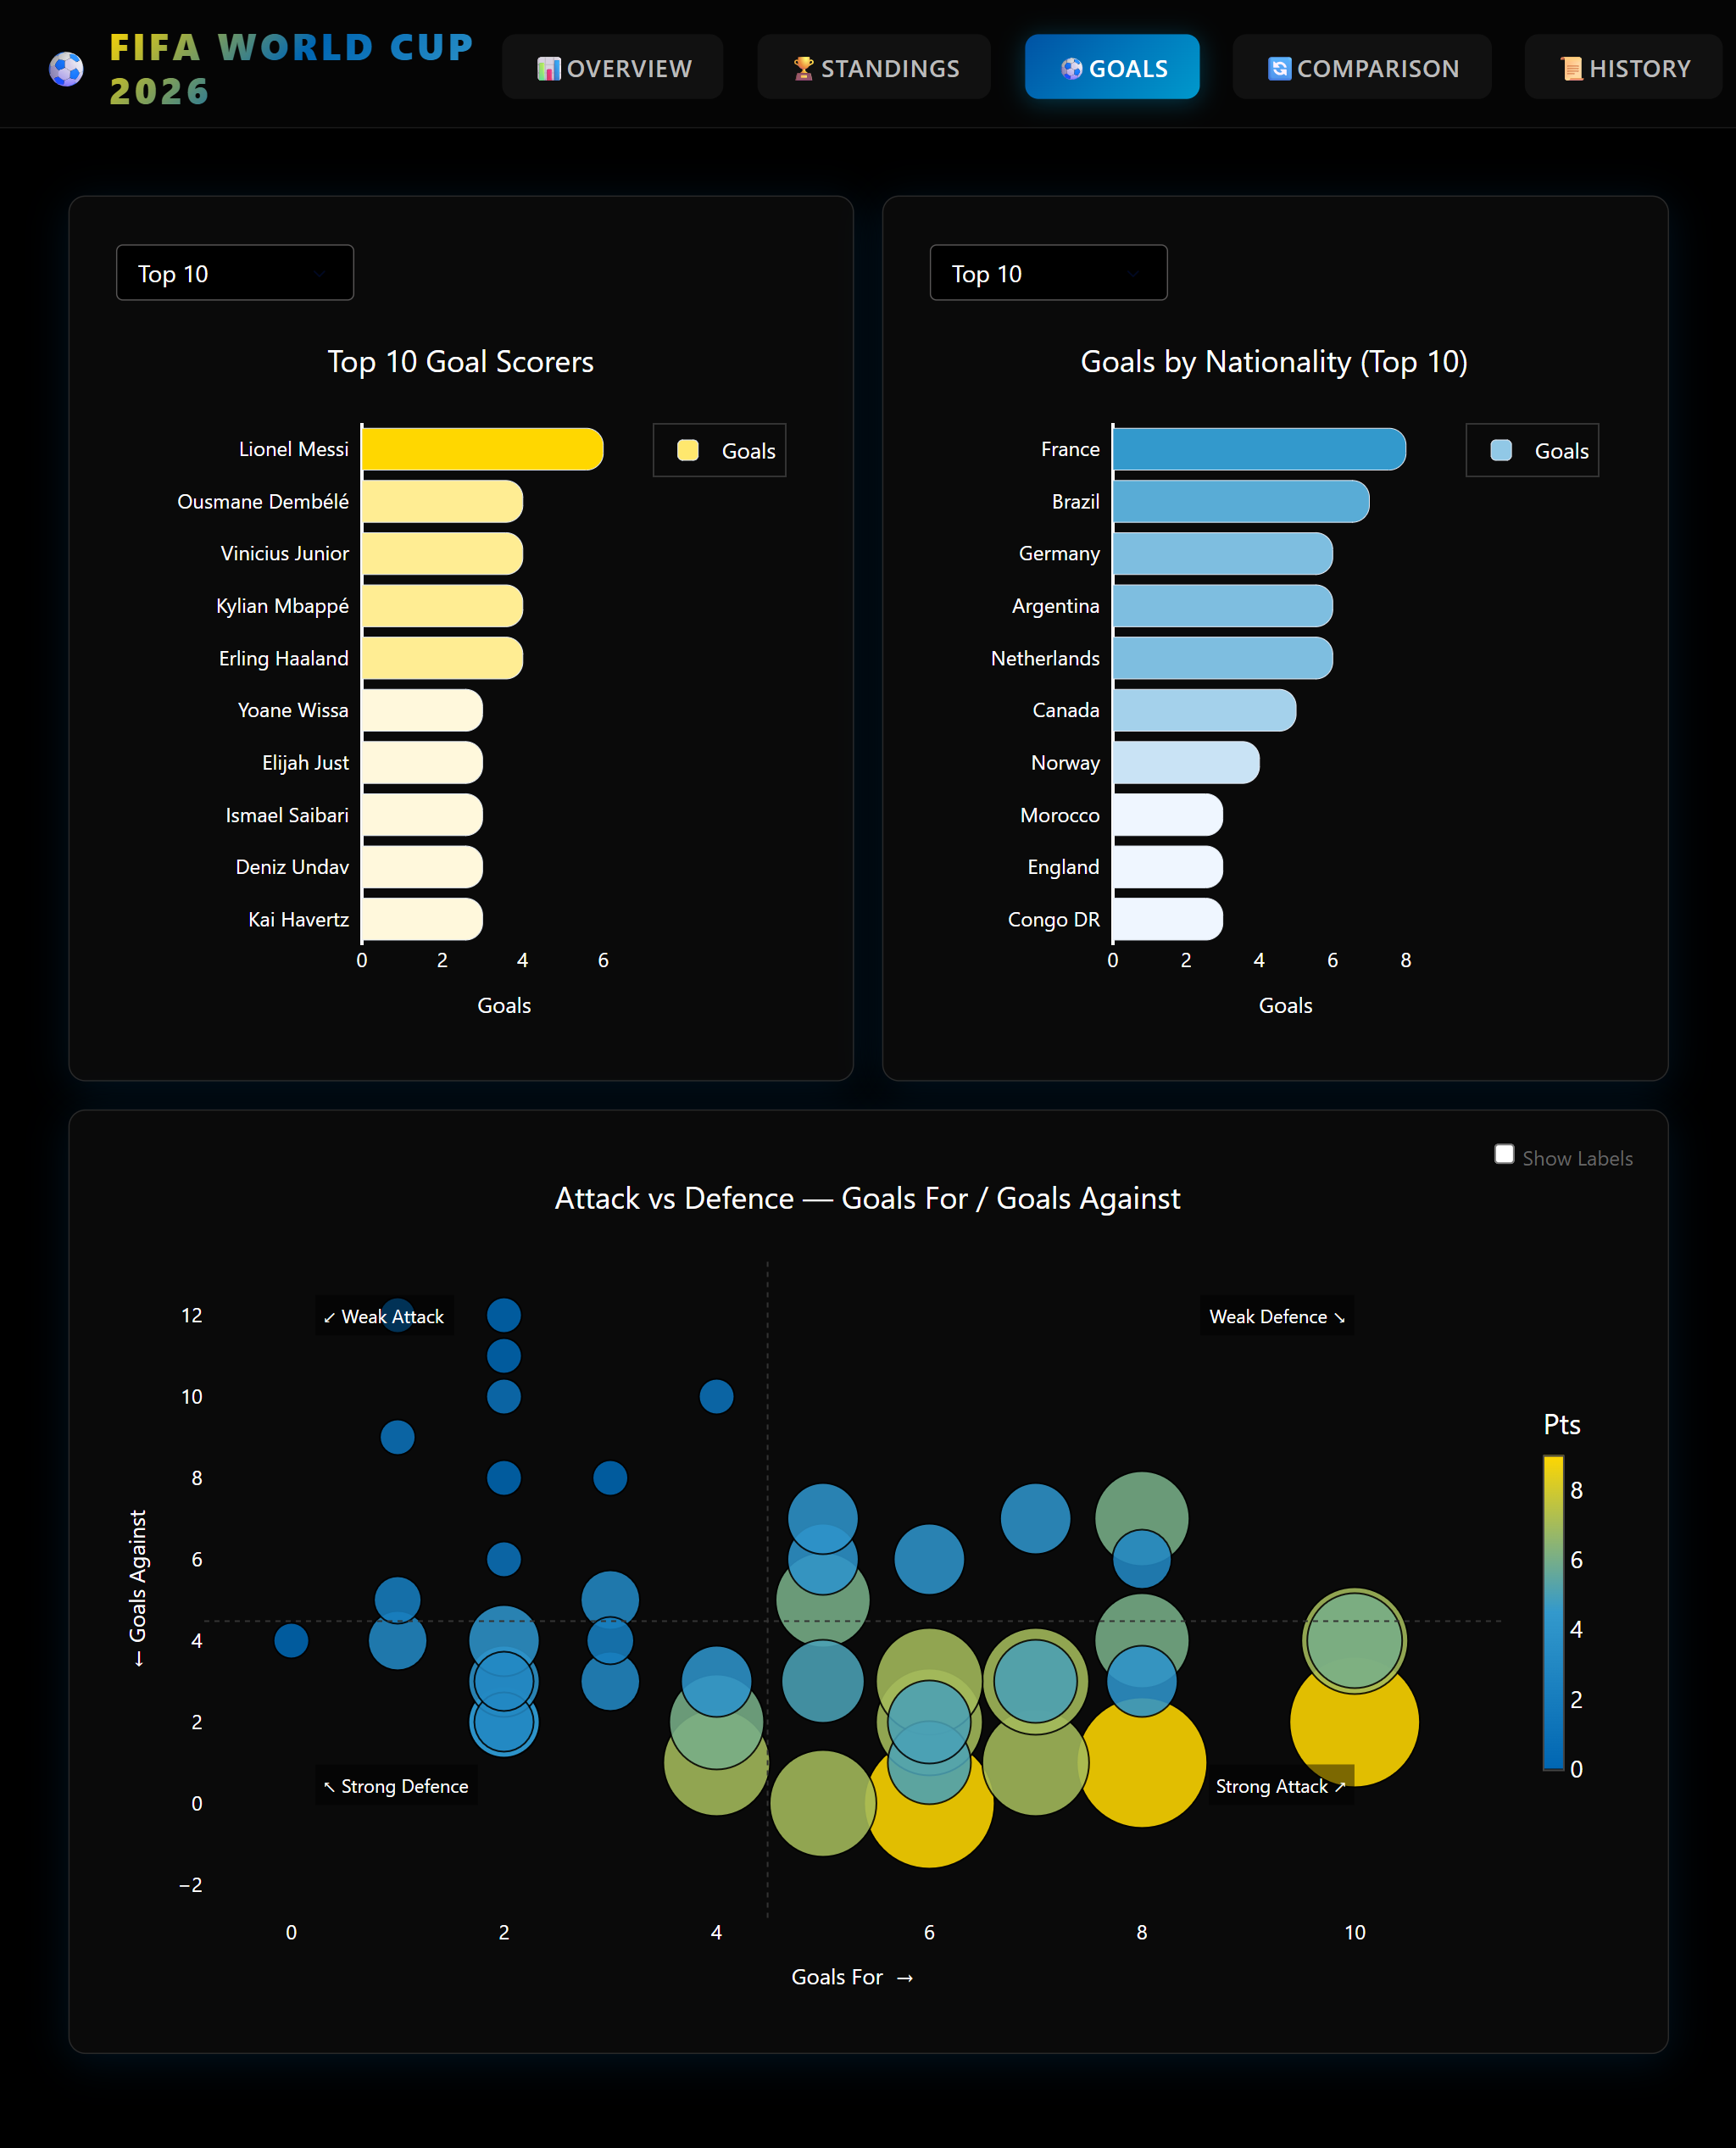
  • Goals — Top Scorers and Goals-by-Nationality bar charts (selectable Top 5/10/All), and a Goals-For-vs-Goals-Against bubble scatter with an optional label toggle.
  • Comparison — pick any two teams to compare side-by-side via stat cards, a grouped bar chart, and a radar chart.
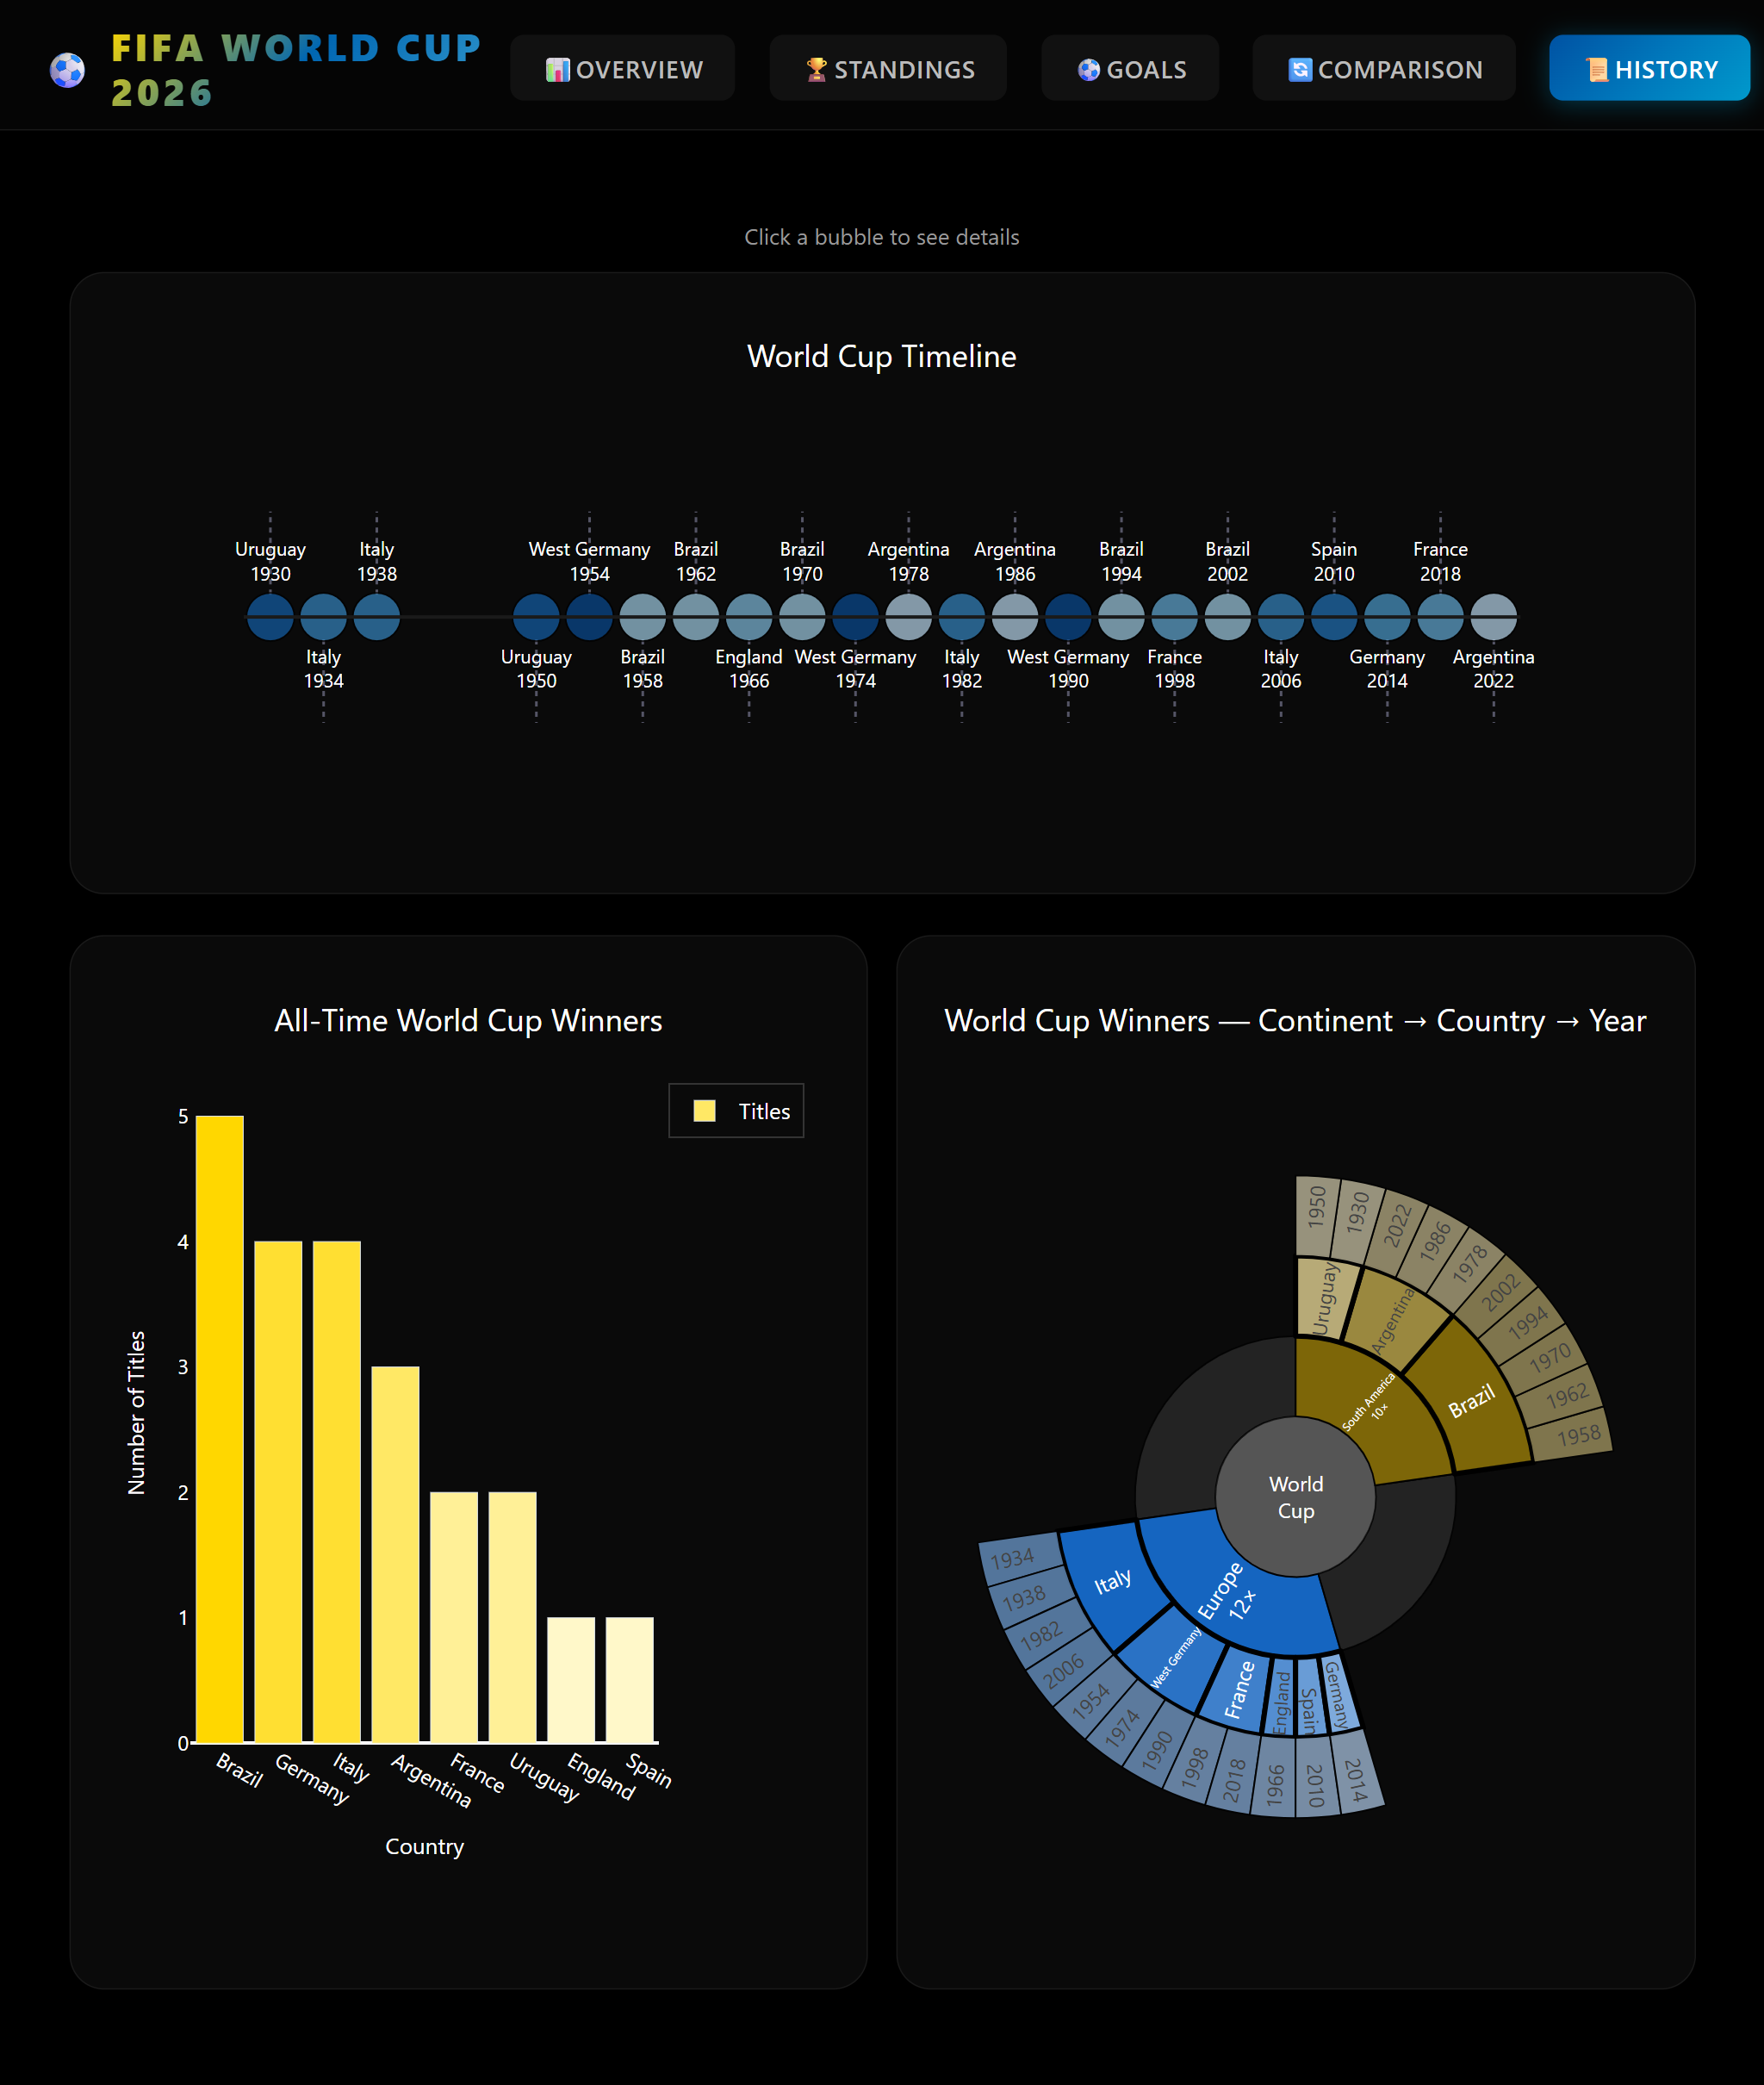
  • History — an interactive winners timeline back to 1930 (horizontal on desktop, vertical on mobile); clicking a bubble reveals a gradient detail card with that year’s champion and final score. Also includes a Continent → Country → Year sunburst chart and an all-time titles bar chart.
  • Stats — a sortable, filterable player statistics table with per-column heatmap shading (Goals/Assists/Penalties) and a row-hover color-invert effect for readability; columns narrow further on mobile so the whole table fits without horizontal scrolling.

Design:

  • Fully responsive layout with breakpoints for tablet and mobile.
  • Consistent dark visual language throughout: black backgrounds, 10px-rounded cards/charts, and a blue-to-gold accent palette.

FINAL UPDATE:

All information can be found in

Group Standings: All 12 groups with live tables showing points, wins, draws, losses, goal difference, goals for/against, and 5-match form dots. Top-2 advancement highlighted in green, elimination in grey.

Live Matches: Dedicated live page that auto-refreshes every 20 seconds. Shows real-time scores with pulsing live indicators for every match in progress. Displays next upcoming fixtures when no matches are live.

Match Browser: All 104 fixtures organised by date. Click any match card to open a detail modal with full-time score, half-time score, head-to-head record, a Plotly H2H goals chart for the last 10 meetings, and referee information. Live match modals auto-refresh every 20 seconds.

Golden Boot Race: Top scorers leaderboard with visual goal bars, assist counts, goal involvements (GI = goals + assists), and penalty breakdown. Includes a full Plotly bar chart of the top 20 scorers and a medal-ranked leaderboard with GI badges.

Goals & Charts: Tournament-wide scoring analysis with a dual-axis group goals chart (total goals + goals-per-match line), top scorer bar chart, and a full Golden Boot leaderboard with medal rankings and GI stats.

Knockout Bracket: Automatically populates with Round of 32, Round of 16, Quarter Finals, Semi Finals, Third Place, and Final once the group stage ends. Each stage is a collapsible accordion completed rounds fold automatically, in-progress rounds stay open.

Teams & Squads: Search any of the 48 competing nations to see a full detail card: squad organised by position (GK / DEF / MID / FWD), coach, founding year, venue, club colours, and live group-stage stats (W/D/L, GF:GA, GD, points).

Player Search: Search any player by name from the top navigation. Navigates directly to their team and highlights their chip in gold. Shows a dedicated player stats card with goals, assists, goal involvements, penalties, matches played, nationality, age, and position.

Predictions & Power Rankings: Elo-based power rankings computed from all tournament results. Monte Carlo simulation (400 runs) gives each team a group qualification probability. Championship win probabilities and upcoming-match win/draw/lose predictions for every scheduled fixture.

Fixtures: Complete schedule of all 104 matches with kickoff times in UTC, venue, group or stage label, and current status.

Played Matches: Results and stats for every completed game, including total goals scored, average goals per match, clean sheets, home/away win ratio, and a visual W/D/L breakdown.

About Page: Overview of the dashboard with descriptions and direct links to every section, the full tech stack, and data source attribution.

Light / Dark Theme: Toggle between light and dark mode. Preference is saved to localStorage and persists across sessions.

Social Links & Footer: GitHub and LinkedIn links in both the navigation bar and the footer, alongside data attribution and tech credits.

Thank you everyone for this impressive submissions.
The Plotly judging committee will review these apps and share the final decision on July 20.