Error: callback returns blank subplot in Callback

Hello everybody,

I have the following problem: I want to use the a DatePickerRange to be able to Zoom into a specific time range via callback. The DatePickerRange works fine so far but the figure doesn’t get Updates by the callback, so I just get a blank figure.

My Code looks like this:

app = Dash()


app.layout = html.Div([
    dcc.Graph(id = 'SoC_line_chart', style={"border":"2px solid black",'width': '100%', 'height': '65vh', 'display': 'inline-block'}),
    
dcc.DatePickerRange(
        id='my-date-picker-range',
        min_date_allowed=date(1995, 8, 5),
        max_date_allowed=date(2024, 9, 19),
        initial_visible_month=date(2022, 8, 5),
        start_date_placeholder_text="Start Period",
        end_date_placeholder_text="End Period",
        
    ),
    html.Div(id='output-container-date-picker-range')
])

@app.callback(
    Output('SoC_line_chart', 'figure'),
    [Input('my-date-picker-range', 'start_date'),
    Input('my-date-picker-range', 'end_date')])

def update_SoC_line_chart(start_date,end_date):
        Result_all_f = Result_all.loc[Result_all["Time_stamp"].between(*pd.to_datetime([start_date, end_date]))]
        fig = make_subplots(specs=[[{"secondary_y": True}]])
        fig.add_trace(go.Scatter(x=Result_all_f['Time_stamp'], y = Result_all_f['x_SoC_Batt'], name= 'x_SoC_Batt'),secondary_y=False)
        fig.add_trace(go.Scatter(x=Result_all_f['Time_stamp'], y = Result_all_f['x_SoC_EV'],name = 'x_SoC_EV'), secondary_y=False)
        fig.add_trace(go.Scatter(x=Result_all_f['Time_stamp'], y = Result_all_f['E_EV_pluggedIn'],fill='toself',fillcolor = '#D3D3D3', opacity=0.3,name = 'EV_pluggedIn'),secondary_y=True).update_layout(title='SoC_line_chart', plot_bgcolor='rgb(220,220,220)')
    
    return fig

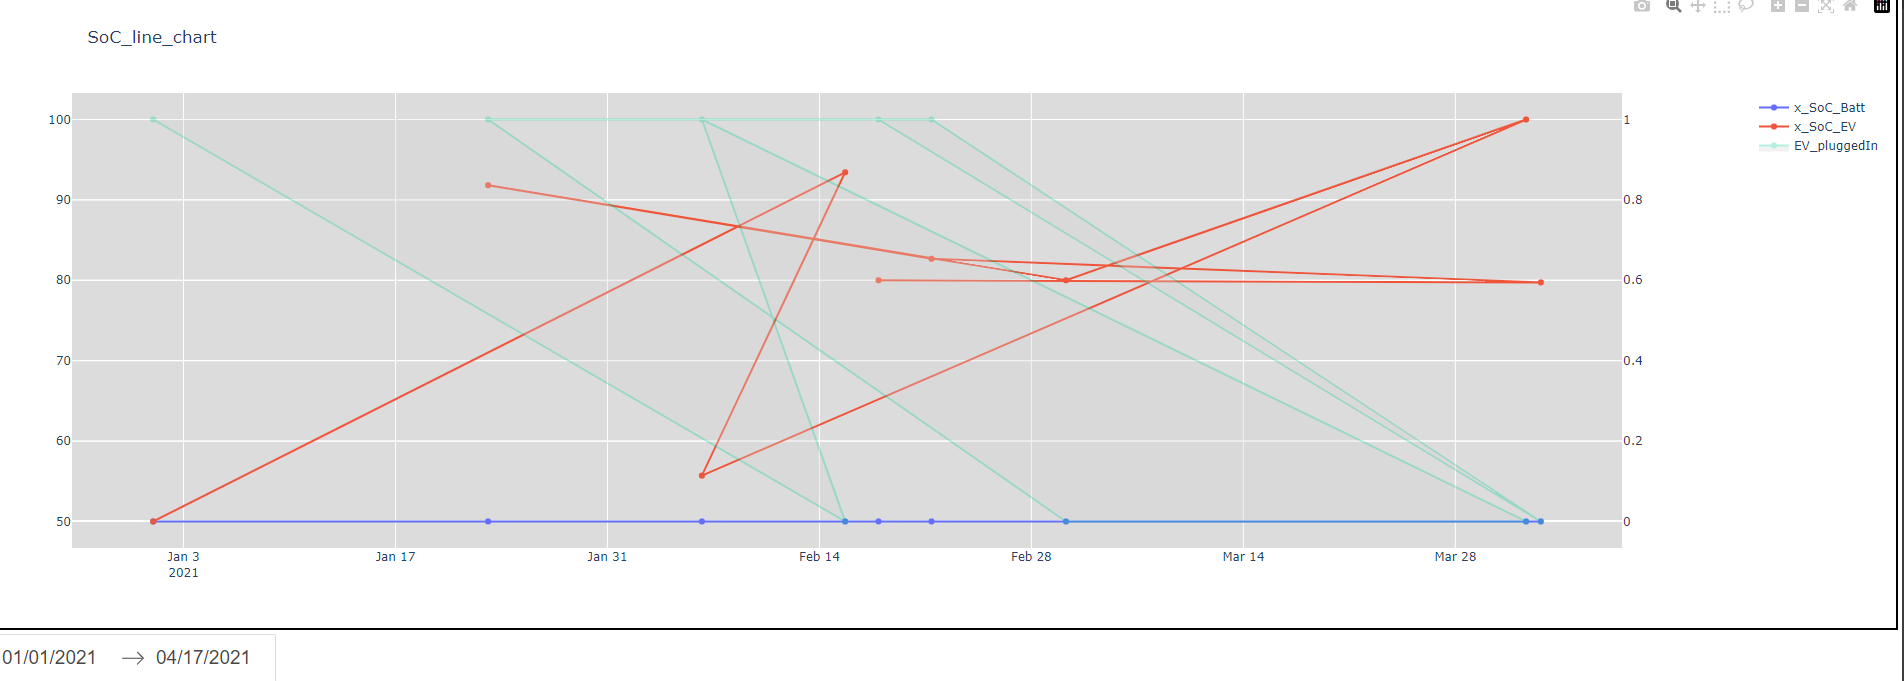
And the result like this:

Does anyone know this problem or how to fix this?

Thank you in advance!
Johanna

hi @JoSc
can you share with us the Result_all data set so we can run this code locally?

Hi,

could you share this in a different way so that the people can copy&paste it directly?

Time_stamp x_SoC_Batt x_SoC_EV x_E_Grid_imp x_E_Grid_exp x_E_Batt_charge x_E_Batt_discharge x_E_EV_charge x_E_EV_discharge E_Load_el E_PV_Prod E_EV_pluggedIn C_Batt_SoC C_EV_SoC C_Grid_imp_price_static C_Grid_exp_price_static C_Grid_imp_price_dynamic C_Grid_exp_price_dynamic
0 2021-01-01 00:00:00 50.0 50.0 394.77725 0.0 0.0 0.0 0.0 0.0 394.77725 0.0 1 0.1 0.13 0.4 0.13 0.27711529999999995 0
1 2021-02-15 16:50:00 50.0 93.43191078846152 772.5034 0.0 0.0 0.0 0.0 0.0 772.5034 0.0 0 0.1 0.13 0.3949900793650794 0.13500992063492065 0.2772938 0
2 2021-02-06 05:40:00 50.0 55.7000012498813 424.997 0.0 0.0 0.0 0.0 0.0 424.997 0.0 1 0.1 0.13 0.3983134920634921 0.13168650793650793 0.25831329999999997 0
3 2021-04-01 16:10:00 50.0 100.0 2.2737367544323206e-13 741.3970166666668 0.0 0.0 0.0 0.0 722.6773666666666 1464.0743833333331 0 0.1 0.13 0.3951884920634921 0.13481150793650795 0.26775 0
4 2021-03-02 06:50:00 50.0 79.99999999999999 1335.6912 0.0 0.0 0.0 0.0 0.0 1578.9821833333333 243.29098333333332 0 0.1 0.13 0.39796626984126987 0.13203373015873016 0.28311289999999995 0
5 2021-06-01 11:30:00 50.0 86.63057692307693 714.3830833333333 0.0 0.0 0.0 0.0 0.0 714.3830833333333 0.0 1 0.1 0.13 0.396577380952381 0.13342261904761904 0.28928899999999996 0
6 2021-01-23 02:50:00 50.0 91.82639023557695 447.25993333333327 0.0 0.0 0.0 0.0 0.0 447.25993333333327 0.0 1 0.1 0.13 0.39915674603174606 0.13084325396825397 0.26939219999999997 0
7 2021-02-21 09:40:00 50.0 82.67524493738131 0.0 0.0 0.0 0.0 3386.163516666666 0.0 414.47751666666665 3800.641033333333 1 0.1 0.13 0.3971230158730159 0.13287698412698412 0.25773019999999996 0
8 2021-04-02 15:30:00 50.0 79.7357005977564 598.4028166666667 0.0 0.0 0.0 0.0 0.0 940.2305 341.8276833333333 0 0.1 0.13 0.3953869047619048 0.13461309523809525 0.1916495 0
9 2021-02-17 21:40:00 50.0 80.0 805.3485333333333 0.0 0.0 0.0 0.0 0.0 805.3485333333333 0.0 1 0.1 0.13 0.39355158730158735 0.1364484126984127 0.2741403 0

@JoSc

I seem to get this to work.

A couple of things I noticed:

First, I needed to make sure the Time_stamp was a pd.datetime.

Result_all['Time_stamp'] = pd.to_datetime(Result_all['Time_stamp'])

Second, I needed to make sure my date selection was inside the time set. I changed your code to take the min and max from the data.

app.layout = html.Div([
    dcc.Graph(id='SoC_line_chart',
              style={"border": "2px solid black", 'width': '100%', 'height': '65vh', 'display': 'inline-block'}),

    dcc.DatePickerRange(
        id='my-date-picker-range',
        min_date_allowed=Result_all['Time_stamp'].min(),
        max_date_allowed=Result_all['Time_stamp'].max(),
        initial_visible_month=Result_all['Time_stamp'].median(),
        start_date_placeholder_text="Start Period",
        end_date_placeholder_text="End Period",

    ),
    html.Div(id='output-container-date-picker-range')
])

1 Like

@jinnyzor
Yeah that was it! Thank you very much!