I’ve noticed that a Plotly figure embedded in Dash does not honor all parameters as if it were rendered as a pure Plotly figure. For example, the below code returns different plots between the two platforms
note x is a pandas Series object of floats, y is a pandas Series object of strings (labels). This is essentially a budget plot displaying percent of budget expended.
fig = go.Figure(

        data=[go.Bar(x=x, y=y,
                    name='Discretionary Spending',
                    orientation='h',
                    marker_color=(
                        ['#FF6666' if a > 1 else '#00CC66' for a in x]
                    ),
                    text=x,
                    textposition='auto',
                    texttemplate='%{x:.0%}',
                    textfont=dict(size=10),
                    insidetextanchor='start',
                    )],

        layout=go.Layout(
            title=go.layout.Title(text="Discretionary Spending"),
            xaxis=dict(showgrid=False,
                    visible=False),
            paper_bgcolor='white',
            plot_bgcolor='white',
            height=650
        )
    )
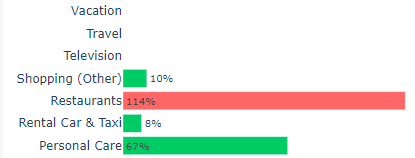
When run as a python script, the plot looks like this (displayed in my browser):
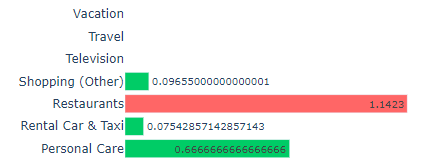
When embedded in a dash dcc.Graph, it looks like this:
Any thoughts on why parameters like insidetextanchor and texttemplate are not honored in the Dash environment?