Hi all 
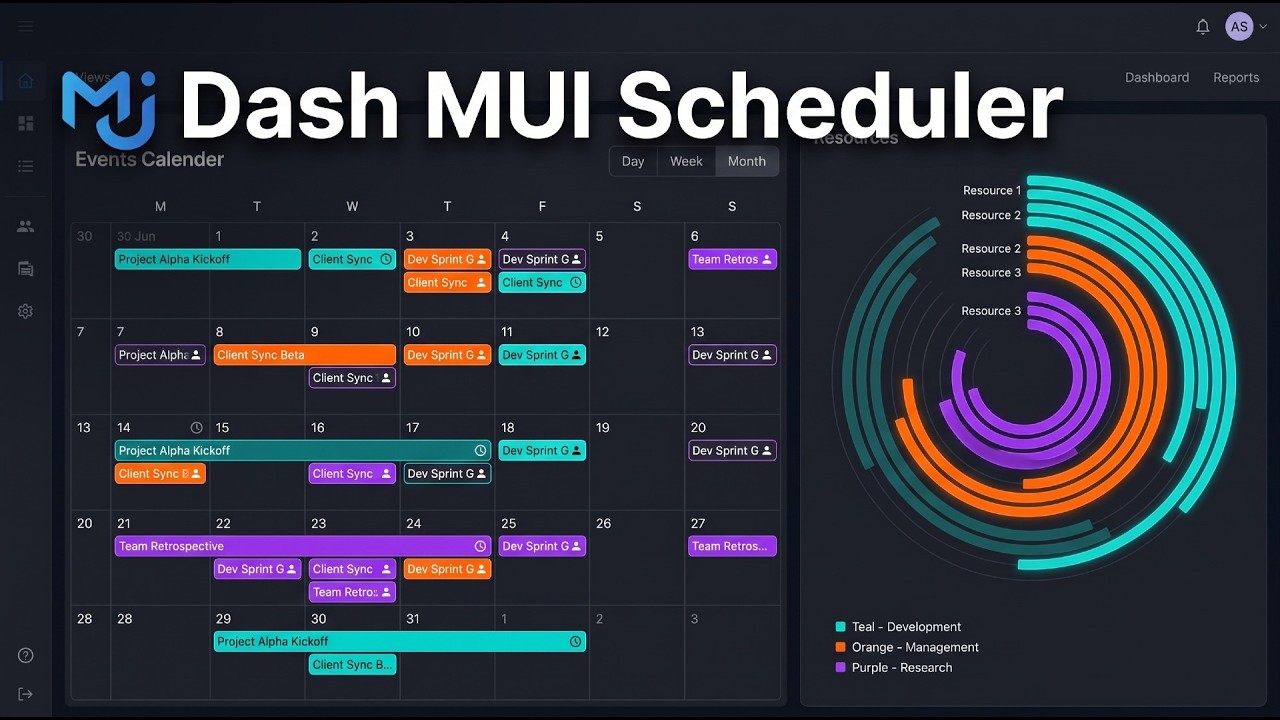
Demo App:
I just released dash-mui-scheduler, a new component library that brings the MUI X Scheduler and the MUI X Premium radial charts into Dash as first-class Python components. If you’ve ever wanted a real drag-and-drop calendar, a Gantt-style resource timeline, or polar charts — without touching a line of React — this is for you.

link to the canvas showcase of dash-mui-scheduler - ai-agent.buzz | AI Whiteboard
pip install dash-mui-scheduler
The whole library loads from a single bundled JS file — no external_scripts, no extra CSS, no React setup. And the data boundary is dead simple: events is a plain list of dicts that’s both an input and an output. Seed it with your data; the component writes the full new array back into the same prop whenever the user creates, moves, resizes, edits, or deletes something. A companion lastAction output tells you exactly what changed:
{"type": "move", "event": {...}, "event_timestamp": 1721160000}
Dates cross the boundary as ISO strings (“2024-01-15T10:00:00”) — no datetime objects to wrangle. Dark mode follows your surrounding Dash Mantine Components color scheme automatically.
Let me show you the three components I’m most excited about. 
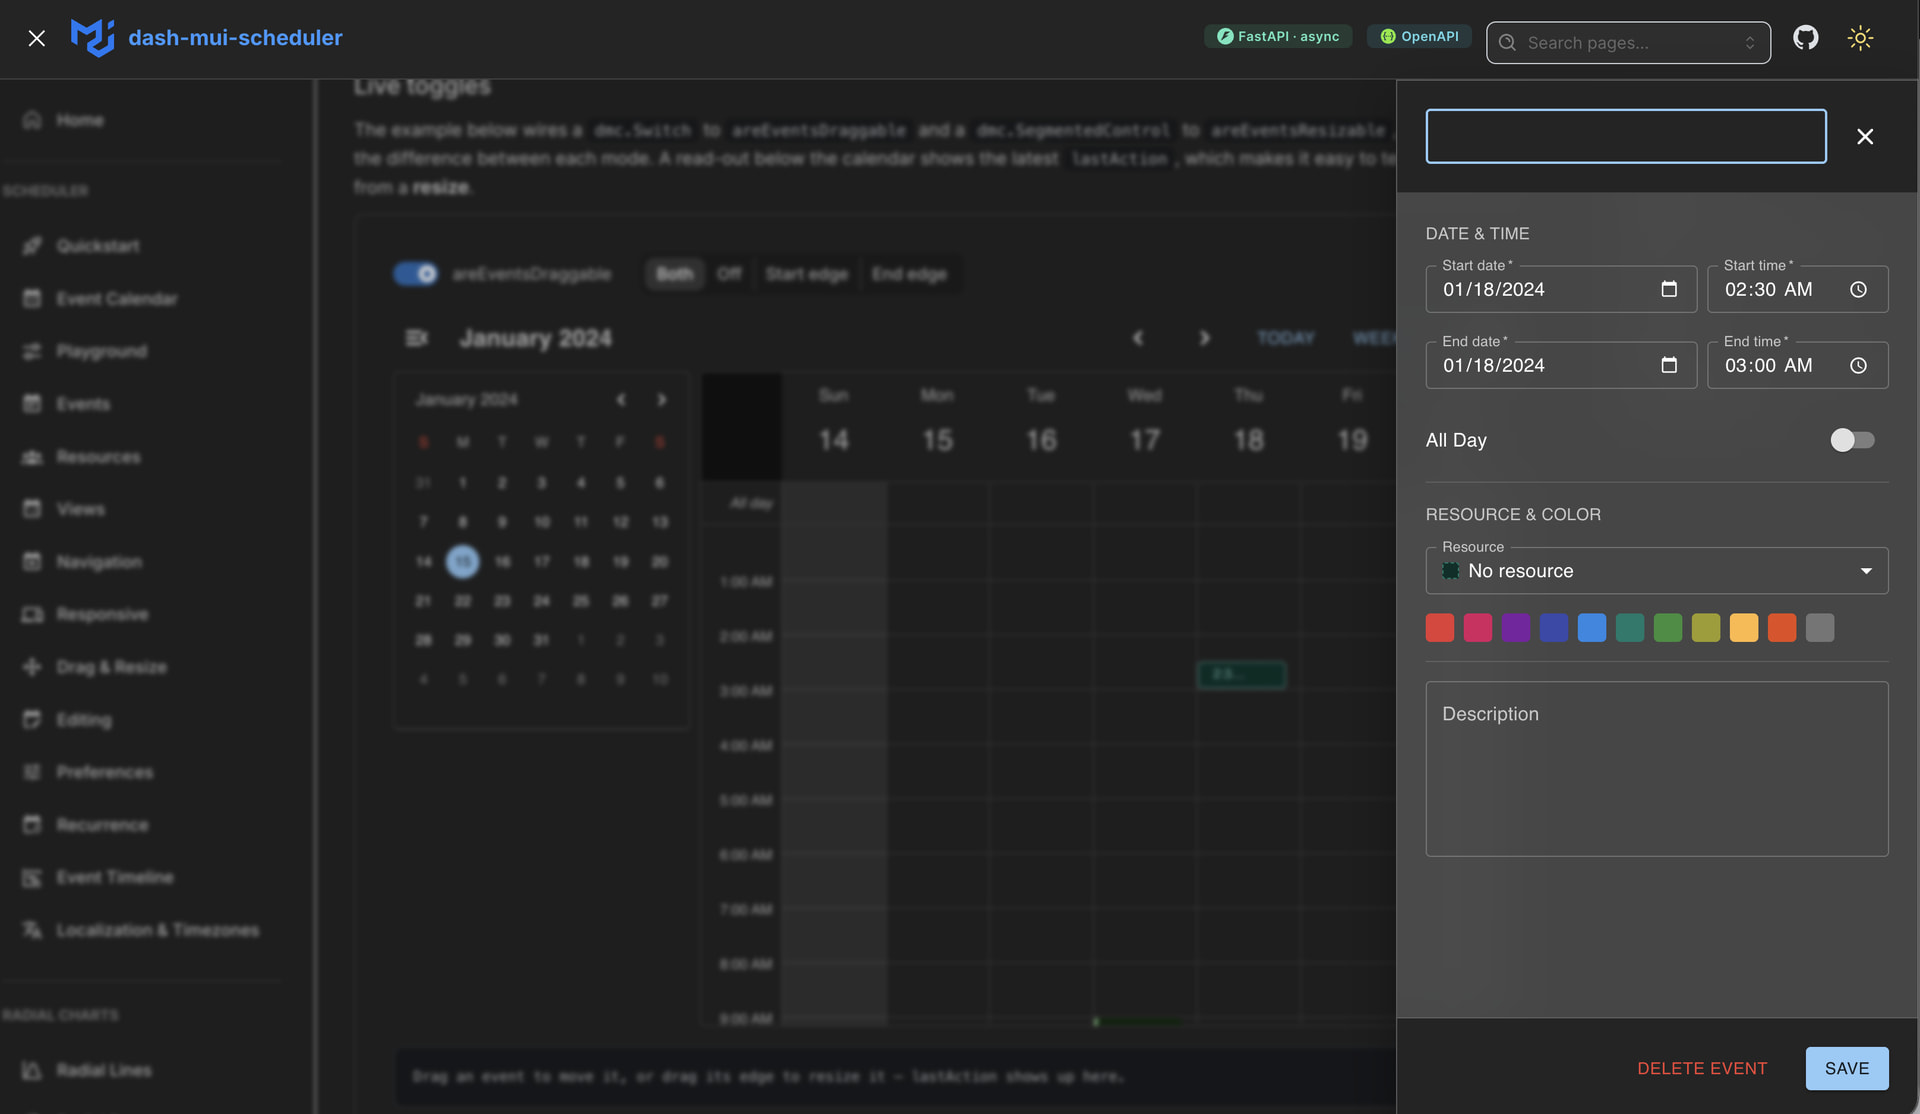
1️ EventCalendar — a real calendar in ~10 lines
Day / week / month / agenda views, drag-and-drop, resizing, resources, and an editing dialog. This one is Community-licensed (MIT) — no license key required.
  import dash
  from dash import Dash, html, Input, Output, callback
  import dash_mui_scheduler as dms

  app = Dash(__name__)

  events = [
      {"id": "1", "title": "Team Meeting",   "start": "2024-01-15T10:00:00", "end": "2024-01-15T11:00:00", "color": "blue"},
      {"id": "2", "title": "Project Review", "start": "2024-01-16T14:00:00", "end": "2024-01-16T15:30:00", "color": "purple"},
      {"id": "3", "title": "Client Call",    "start": "2024-01-17T09:00:00", "end": "2024-01-17T10:00:00", "color": "green"},
  ]

  app.layout = html.Div(
      dms.EventCalendar(id="cal", events=events, defaultVisibleDate="2024-01-15", height=600),
      style={"maxWidth": 1000, "margin": "2rem auto"},
  )

  @callback(Output("cal", "events"), Input("cal", "lastAction"), prevent_initial_call=True)
  def on_change(last_action):
      print("user did:", last_action)   # {'type': 'move', 'event': {...}, ...}
      return dash.no_update

  if __name__ == "__main__":
      app.run(debug=True)
Drag an event to a new slot and your callback fires with the full updated array. That’s the whole model.
(Recurring events — RFC 5545 rrule strings with per-occurrence exceptions — live in the Premium EventCalendarPremium variant.)
2️ EventTimeline — resource-row Gantt view (Premium)
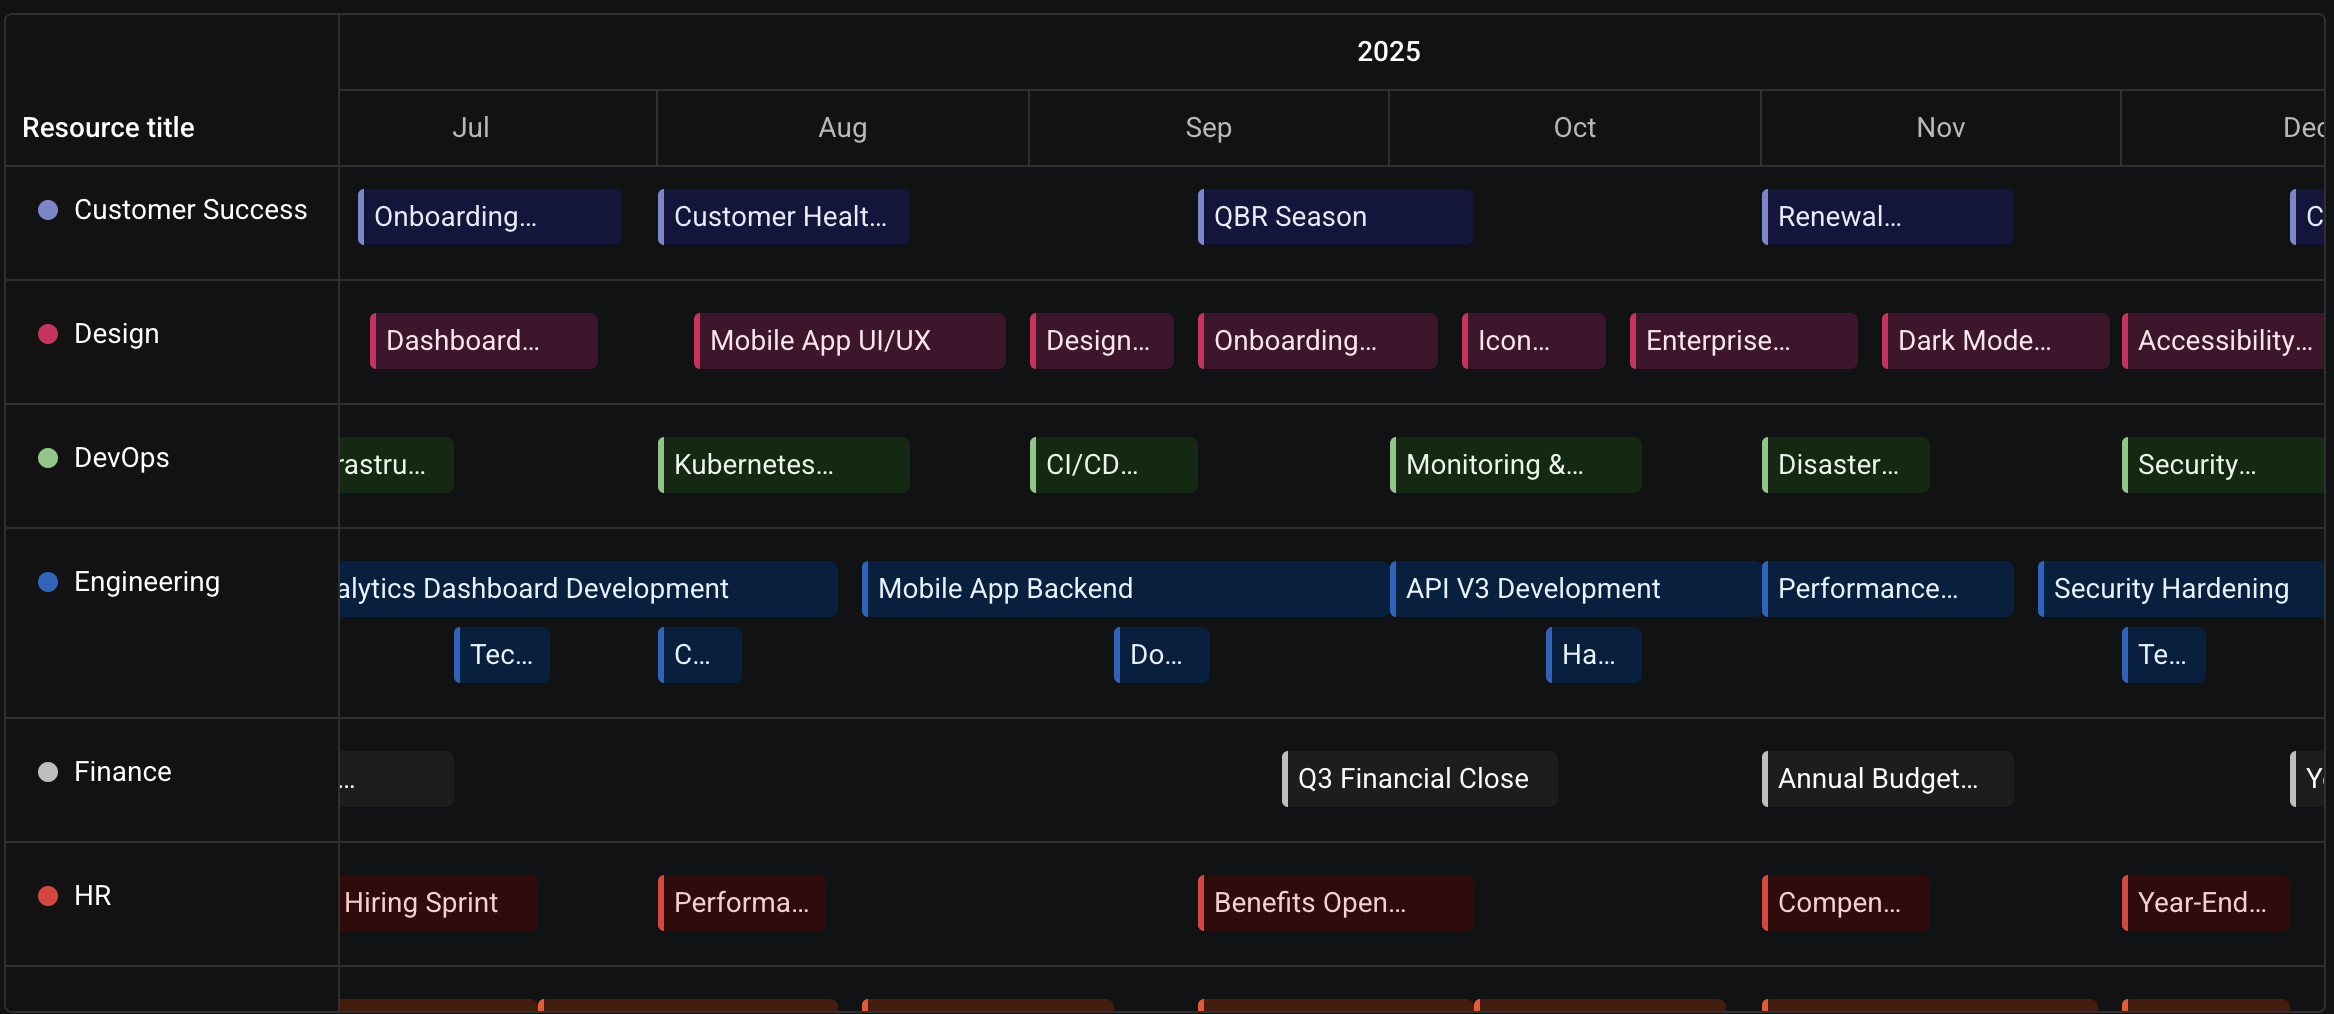
Here resources are the rows and events are allocation bars that span across them. Great for team allocation, room booking, or any “who’s doing what, when” planning board. Configurable zoom presets
(time / days / weeks / months / years).
  import os
  from dash import html
  import dash_mui_scheduler as dms

  # Resources become the ROWS; each event sits on the row whose id matches its `resource`.
  resources = [
      {"id": "team-a", "title": "Team A", "eventColor": "blue"},
      {"id": "team-b", "title": "Team B", "eventColor": "green"},
      {"id": "team-c", "title": "Team C", "eventColor": "orange"},
  ]

  events = [
      {"id": "alloc-1", "title": "Discovery",       "start": "2024-01-15T09:00:00", "end": "2024-01-17T17:00:00", "resource": "team-a"},
      {"id": "alloc-2", "title": "Build phase",     "start": "2024-01-18T09:00:00", "end": "2024-01-23T17:00:00", "resource": "team-a"},
      {"id": "alloc-3", "title": "API integration", "start": "2024-01-16T09:00:00", "end": "2024-01-20T17:00:00", "resource": "team-b"},
      {"id": "alloc-4", "title": "QA & hardening",  "start": "2024-01-22T09:00:00", "end": "2024-01-25T17:00:00", "resource": "team-b"},
      {"id": "alloc-5", "title": "Launch prep",     "start": "2024-01-19T09:00:00", "end": "2024-01-24T17:00:00", "resource": "team-c"},
  ]

  component = html.Div(
      dms.EventTimeline(
          id="timeline",
          licenseKey=os.environ.get("MUI_X_LICENSE_KEY", ""),
          events=events,
          resources=resources,
          resourceColumnLabel="Team",
          defaultPreset="dayAndWeek",
          defaultVisibleDate="2024-01-15",
          height=400,
      )
  )
Same events / lastAction boundary as the calendar — drag a bar to reschedule and it round-trips straight back into your callback.
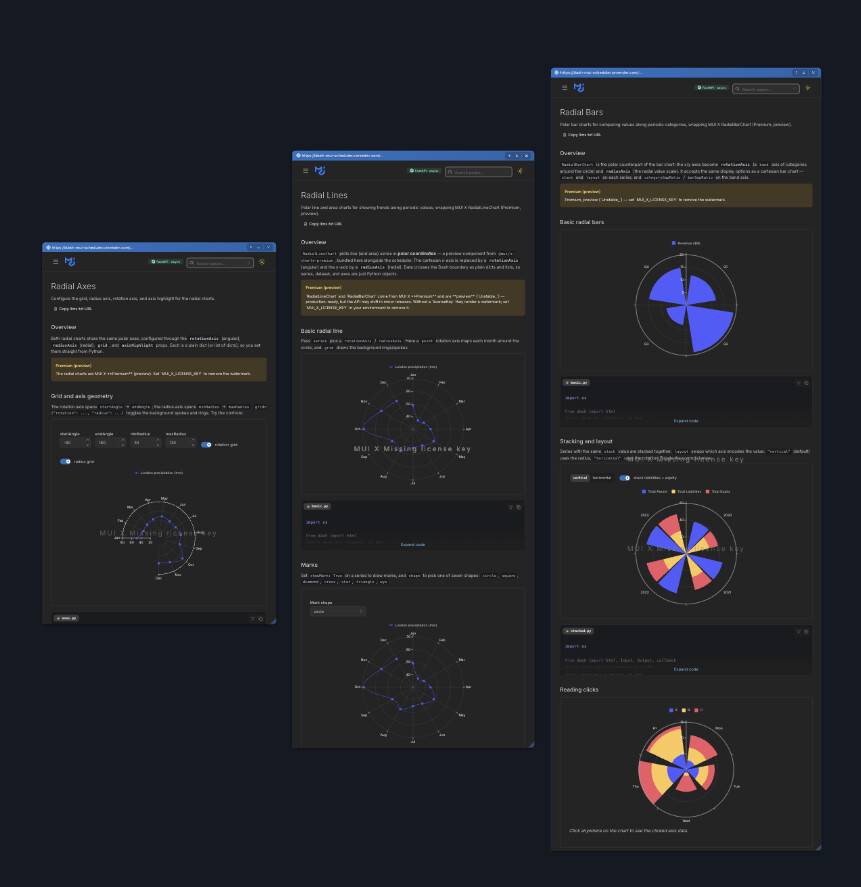
3️ RadialLineChart — polar charts for periodic data (Premium, preview)
Wrapping @mui/x-charts-premium, this is a polar line/area chart — perfect for anything cyclical (months of the year, hours of the day, compass headings). Row-oriented dataset + series that reference
columns by dataKey. rotationAxis is the angular (x-like) axis; radiusAxis is the radial (y-like) one.
  import os
  from dash import html
  import dash_mui_scheduler as dms

  dataset = [
      {"month": "Jan", "london": 49}, {"month": "Feb", "london": 38},
      {"month": "Mar", "london": 40}, {"month": "Apr", "london": 44},
      {"month": "May", "london": 49}, {"month": "Jun", "london": 45},
      {"month": "Jul", "london": 45}, {"month": "Aug", "london": 50},
      {"month": "Sep", "london": 49}, {"month": "Oct", "london": 69},
      {"month": "Nov", "london": 59}, {"month": "Dec", "london": 56},
  ]

  component = html.Div(
      dms.RadialLineChart(
          id="polar",
          height=400,
          licenseKey=os.environ.get("MUI_X_LICENSE_KEY", ""),
          dataset=dataset,
          series=[{"dataKey": "london", "label": "London precipitation (mm)", "curve": "natural", "showMark": True}],
          rotationAxis=[{"scaleType": "point", "dataKey": "month", "disableLine": True}],
          radiusAxis=[{"disableLine": True}],
          grid={"rotation": True, "radius": True},
      )
  )
Axis and item clicks surface through a clickData output, so you can wire up drill-down callbacks. There’s a matching RadialBarChart too.
 A note on Premium licensing
EventCalendar is fully MIT — use it freely. The Premium pieces (EventCalendarPremium, EventTimeline, and the radial charts) wrap MUI X Premium libraries; without a valid MUI X Premium license key they render a watermark. They all share the same @mui/x-license@9 singleton, so a single key covers everything. Pass it from the environment, never hard-coded:
dms.EventTimeline(id="tl", licenseKey=os.environ["MUI_X_LICENSE_KEY"], ...)
The Dash wrapper code in this package is MIT-licensed. The radial charts are Unstable_ previews — production-ready, but their API may still shift. I’m not sponsored, monetized or working with mui-react or Plotly in any capacity at this moment. Just an indi developer/small business. If you purchase a license let mui know I sent you, if enough of ya’ll refer the component we could possibly find the support to maintain the full mui set in the dash framework.
Other note worthy dash calendar based open source projects Scott Kilgore GitHub - ScottTpirate/dash-fullcalendar: Dash FullCalendar is a Dash component wrapper for the FullCalendar JavaScript package, enabling you to display FullCalendar components natively in your Dash app. · GitHub
 Links
Links
 PyPI: dash-mui-scheduler · PyPI
 GitHub: GitHub - pip-install-python/dash-mui-scheduler: MUI X Scheduler for Plotly Dash — event calendar, resource timeline & radial chart components with recurrence, drag & resize, resources and timezones. Docs: · GitHub
 Live docs (editable demo + source + auto-generated prop table for every example):
The docs cover Quickstart, the Event Calendar, a Playground, Events, Resources, Views, Navigation, Responsive behavior, Drag & Resize, Editing, Preferences, Recurrence, the Event Timeline, Localization & Timezones, plus the radial chart pages — each with a live demo and copy-paste source.
Would love to hear what you build with it, and I’m happy to take feature requests / bug reports and  on GitHub.
Built and maintained by Pip Install Python LLC.