Dash v0.9.0 is a major release introducing the new Pattern-Matching Callbacks feature, as well as an improved callback graph tool in the Dash dev tools UI, among other improvements. We’ll also be releasing this version to CRAN shortly, so stay tuned!
Official Changelog
Dash for R v0.9.0
Highlights
- New Pattern-Matching Callbacks feature that allows you to write callbacks that respond to or update an arbitrary or dynamic number of components. #228
- Streamlined server routing and redirects via the
app$server_routeandapp$redirectmethods.
 #225
#225 - New and improved callback graph in the dev tools UI. Now based on Cytoscape for much more interactivity, plus callback profiling including number of calls, fine-grained time information, bytes sent and received, and more. You can even add custom timing information on the server with
callback_context.record_timing(name, duration, description). #224 - Support for setting attributes on
external_scriptsandexternal_stylesheets, and validation for the parameters passed (attributes are verified, and elements that are lists themselves must be named). #226 - Fixed a bug in the usage of
gluewhich resolves issue #232 via #233. dash-rendererhas been updated to v1.8.3dashHtmlComponentshas been updated to v1.1.1dashCoreComponentshas been updated to v1.13.0dashTablehas been updated to v4.11.0
Pattern-Matching Callbacks!
We’re super excited to announce the availability of pattern-matching callbacks in Dash for R! This feature represents one of the biggest improvements to the Dash core architecture since the framework’s original release in 2017.
The documentation for this feature is available here, and you can also see readymade examples and learn more about this feature within R by typing help(selectors). You’ll also find the page linked from the callback section in the online help, or when requesting help for the selectors themselves, e.g. by typing ?ALL, ?ALLSMALLER, ?MATCH.
Here’s what @chriddyp wrote after we launched this feature for Python:
In August 2017, one month after we released Dash, we opened up a forum topic about one of the framework’s core limitations: Dynamic Controls and Dynamic Output Components. From that thread, we said:
This means that you must generate callbacks for every unique set of input components that could be present on the page.
In Dash, the callback function’s decorator’s aren’t dynamic. Each set of input components can only update a single output component. So, for each unique set of input components that are generated, you must generate a unique output component as well.
This was one of the most viewed & linked-to topics in the forum… a roadblock that many of us ran into when creating more complex Dash applications
The new Pattern-Matching Callbacks feature removes this limitation. It allows you to create callbacks that match a group (or, a “pattern”) of component IDs, rather than just a single callback ID.
The documentation goes into much more detail, but this is just a quick example to give you an idea of what’s possible in less than 100 lines of code:
I’ve translated his original example app from Python for the benefit of our R users ![]()
library(dash)
library(dashHtmlComponents)
library(dashCoreComponents)
library(plotly)

df <- read.csv(
  file = "https://raw.githubusercontent.com/plotly/datasets/master/gapminderDataFiveYear.csv",
  stringsAsFactor=FALSE,
  check.names=FALSE
)

app <- Dash$new()

app$layout(
    htmlDiv(
        list(
            htmlDiv(
                list(
                    dccDropdown(options = lapply(unique(df[,"country"]), function(x) {
                                            list(label = x, value = x)
                                          }),
                                value = "Canada",
                                id = "country",
                                style = list(display = "inline-block",
                                             width = 200)
                    ),
                    htmlButton(
                        "add Chart",
                        id = "add-chart",
                        n_clicks = 0,
                        style = list(display = "inline-block")
                    )
                )
            ),

            htmlDiv(id = "container", children=list())
        )
    )
)

create_figure <- function(df, column_x, column_y, country) {
    df <- df[which(df[, "country"] == country),]
    if (column_x == "year") {
       fig <- plot_ly(df, x = df[,column_x], y = df[,column_y], name = column_x, type = "scatter", mode = "lines")
    } else {
       fig <- plot_ly(df, x = df[,column_x], y = df[,column_y], name = column_x, type = "scatter", mode = "markers")
    }
    fig <- plotly::layout(fig, plot_bgcolor="lightblue", xaxis = list(title=""),
                          yaxis = list(title=""), title=list(text=paste(country, column_y, "vs", column_x),
                          xanchor="right", margin_l=10, margin_r=0, margin_b=30))
    return(fig)
}

app$callback(
  output(id = "container", property = "children"),
  params = list(
      input(id = "add-chart", property = "n_clicks"),
      state(id = "country", property = "value"),
      state(id = "container", property = "children")
  ),
  function(n_clicks, country, children) {
      default_column_x <- "year"
      default_column_y <- "gdpPercap"

      new_element <- htmlDiv(
          style = list(width = "23%", display = "inline-block", outline = "thin lightgrey solid", padding = 10),
          children = list(
              dccGraph(
                  id = list(type = "dynamic-output", index = n_clicks),
                  style = list(height = 300),
                  figure = create_figure(df, default_column_x, default_column_y, country)
              ),
              dccDropdown(
                  id = list(type = "dynamic-dropdown-x", index = n_clicks),
                  options = lapply(colnames(df), function(x) {
                      list(label = x, value = x)
                  }),
                  value = default_column_x
              ),
              dccDropdown(
                  id = list(type = "dynamic-dropdown-y", index = n_clicks),
                  options = lapply(colnames(df), function(x) {
                      list(label = x, value = x)
                  }),
                  value = default_column_y
              )
          )
      )

      children <- c(children, list(new_element))
  }
)

app$callback(
  output(id = list("index" = MATCH, "type" = "dynamic-output"), property = "figure"),
  params = list(
      input(id = list("index" = MATCH, "type" = "dynamic-dropdown-x"), property = "value"),
      input(id = list("index" = MATCH, "type" = "dynamic-dropdown-y"), property = "value"),
      input(id = "country", property = "value")
  ),
  function(column_x, column_y, country) {
      return(create_figure(df, column_x, column_y, country))
  }
)

app$run_server()
We were able to do all of this without changing the stateless architecture that makes Dash so special.Multiple people can view this app at the same time and have independent sessions. Scaling this app to 10s, 100s, or thousands of viewers is as simple as adding more workers or nodes.
Callback Graph’s New Debugging & Performance Tools
The callback graph is a visual representation of your callbacks: which order they are fired in, how long they take, and what data is passed back and forth from the browser to your Python, R, or Julia code. This feature was originally sponsored by a customer in Dash for Python v0.42.0 and was recently improved in this release.

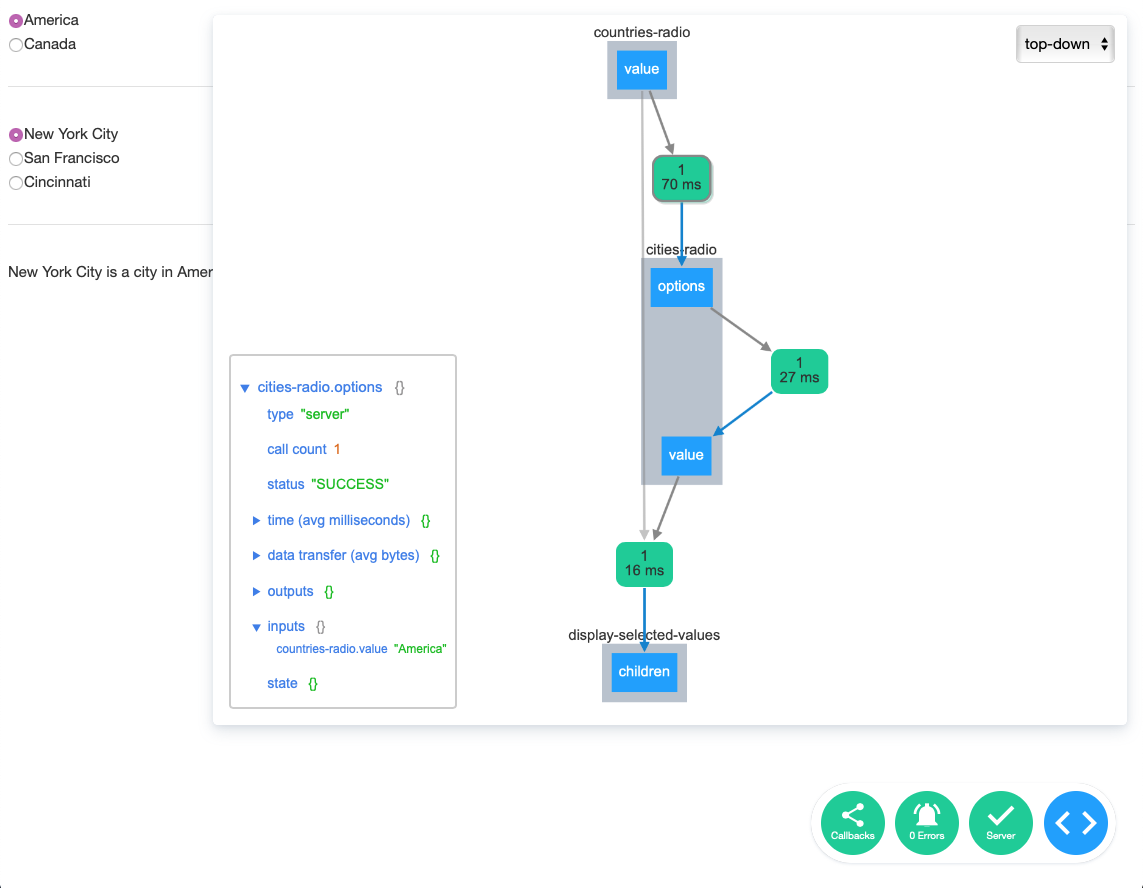
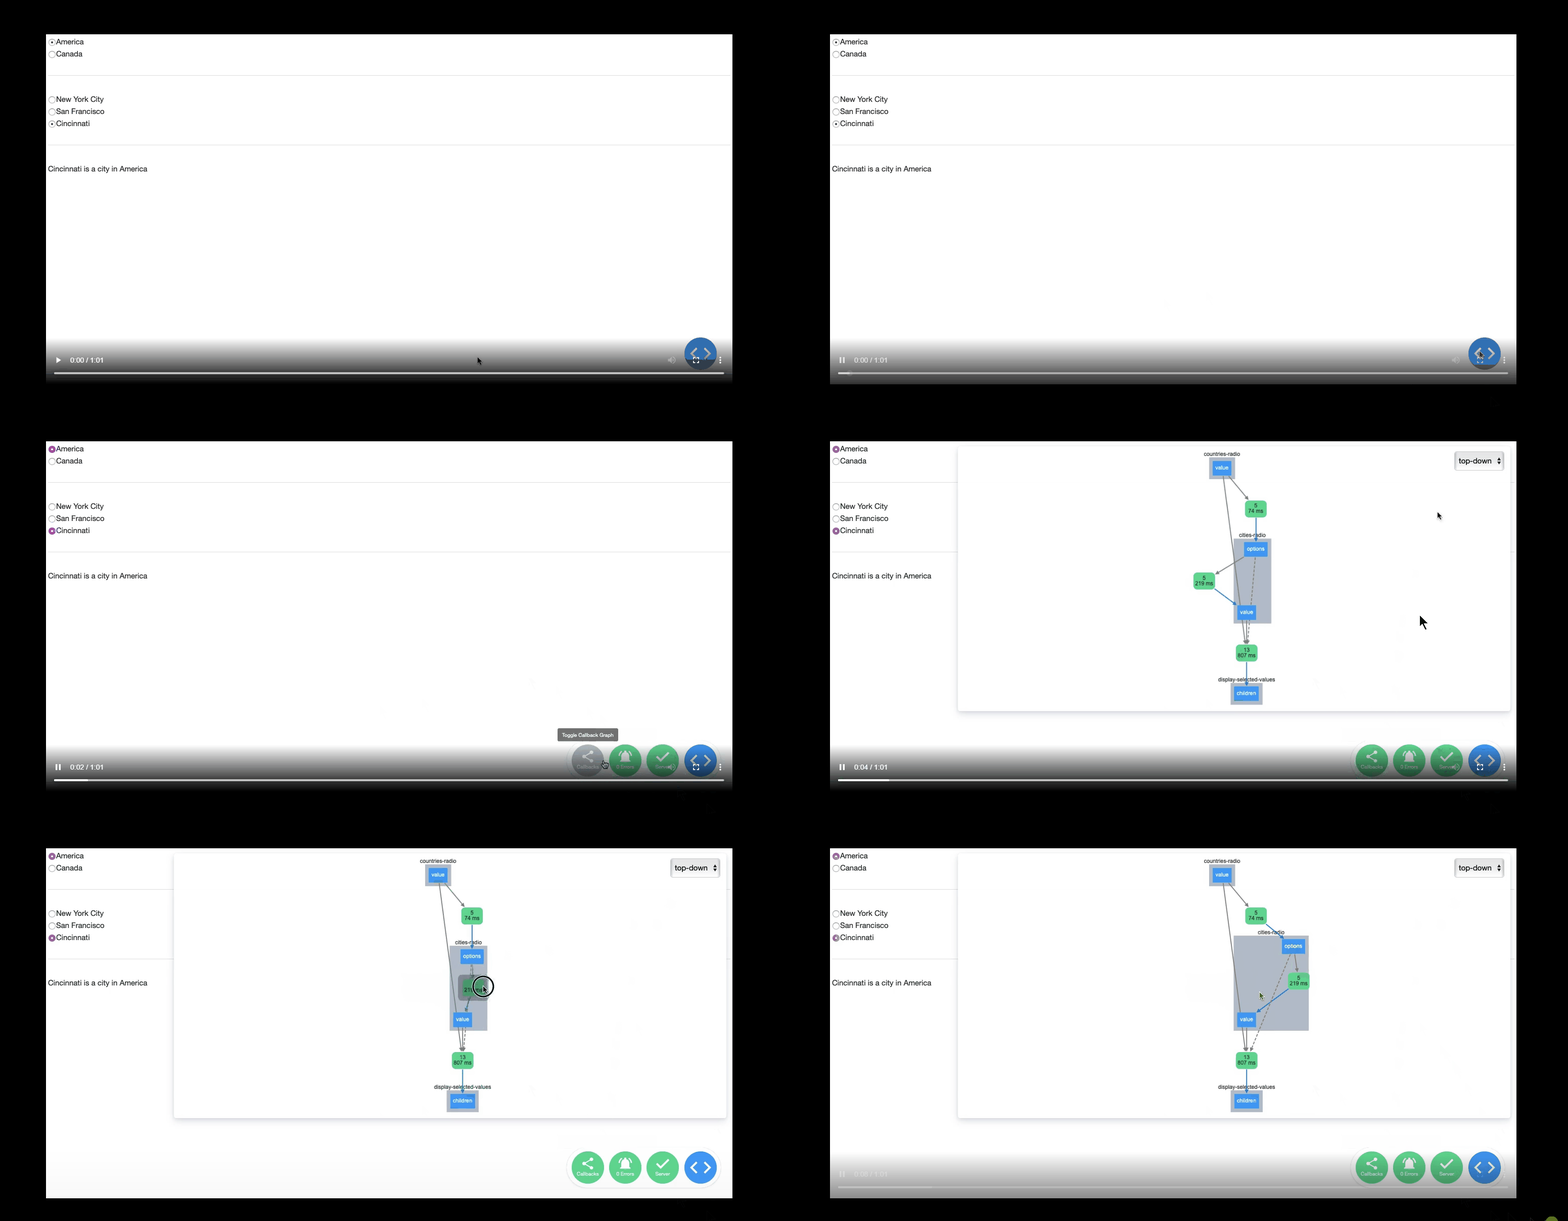
In v0.9.0, the callback graph is now rendered using Cytoscape.js, the network graphing library behind dash-cytoscape. With Cytoscape.js, this graph is now interactive: the elements animate when the callbacks are being fired, you can manually re-arrange elements, and you can click on elements to view timing, performance, & network details of the callback.
60 second video of the feature (no sound)

When you click on a element you’ll see a detailed view of your callback. This detailed view contains things like:
- Call Frequency - How many times the callback has been fired in your session.
- Variable Introspection - The current inputs, outputs, and state of your callback. This can be really helpful if you are puzzled about the shape of the data that is getting passed into your callback or even when you are writing a callback for the first time and want to take a glance at the component’s property.
- Network Time - How long the network request took.
- Compute Time - How long the callback function took.
- Data Transfer - How much data was transferred from the browser to your callback and back.
You can also easily report your own custom timing functions in this view with dash.callback_context.record_timing. For example:
library(plotly)

app$callback(
  output(id = "graph", property = "figure"),
  params = list(
      input(id = "dropdown", property = "value")
  ),
  function(value) {
      # the third value returned by proc.time() is "elapsed" time
      start_1 = proc.time()[3]
      # perform some action
      app$callback_context.record_timing('task_1', proc.time()[3] - start_1, 'The first task')

      start_2 = proc.time()[3]
      # perform another action
      app$callback_context.record_timing('task_2', proc.time()[3] - start_2, 'The second task')

      return(plot_ly(z = ~value))
  }
)
With this, the custom timing data is available in the detailed view:
This is a really easy way to get started debugging the performance of your callback. For example, you might add record_timing calls after a line that does SQL query, a computation, and creating a figure with plot_ly. You can only improve what you can measure!
We’re really excited about how much functionality is packed into this feature. Previously you would’ve had to use some combination of browser’s network tab, custom R timing functions, and your own logging to get all of this data. With the Callback Graph, it’s all built-in for free: nothing to configure.
Support for User-Defined Routes and Simplified Redirects
Dash for R uses the Fiery web framework under the hood. Fiery leverages the routr package to handle routing. While it’s possible to add routes directly via app$server$attach and server$plugins$request_routr, we’ve introduced some convenience methods that are more user-friendly for redirects and other user-defined routes.
The new redirect syntax is particularly succinct – there are three arguments: the old_path argument specifies the path to redirect, while new_path accepts either the path to which requests should be rerouted or a function that is used to construct it, and the methods argument describes the support HTTP methods (with get as its default option).
A quick example of a path-to-path redirect from the /getting-started path to /layout:
app$redirect('/getting-started', '/layout')
For additional details and more complex examples using the app$server_route method, visit the new routes chapter in our online documentation.
Previous Releases
v0.6.0,v0.6.1, andv0.6.2provided fixes fordashTableanddashCoreComponents, as noted in the changelog- Dash for R v0.5.0
- Dash for R v0.4.0
- Dash for R v0.3.0
- Dash for R v0.2.0
- Dash for R v0.1.0


