Welcome to the Dash Club newsletter. Dash Club brings essays and updates about Plotly and Dash to your inbox every 8 weeks. Feedback, questions? Respond to this email.
Chris (@chriddyp) & Adam (@adamschroeder)
Prefer to view this on Medium? Check out the article.
In Dispatch #8
- Version Check
- Dash Enterprise 5.0
- App of the Month
- Component of the Month
- Coming Soon in Dash - Partial Property Updates
- Hiring Product Managers
- Autumn Community App Challenge Winners
- Holiday Community App Challenge
- Deploy Dash App to the Web with Render
- The Book of Dash
- 80 Minimal Code Examples
- Things Happen
—
Version Check
- Dash Enterprise Platform 5.0 (announcement, launch video)
- Dash Open Source Framework 2.7.0 (announcement)
- Dash Open Source Framework 2.6.1 (announcement)
- Plotly.py 5.11.0 (See the changelog)
- Plotly.js 2.16.3 (See the changelog)
—
Dash Enterprise 5.0 is here!
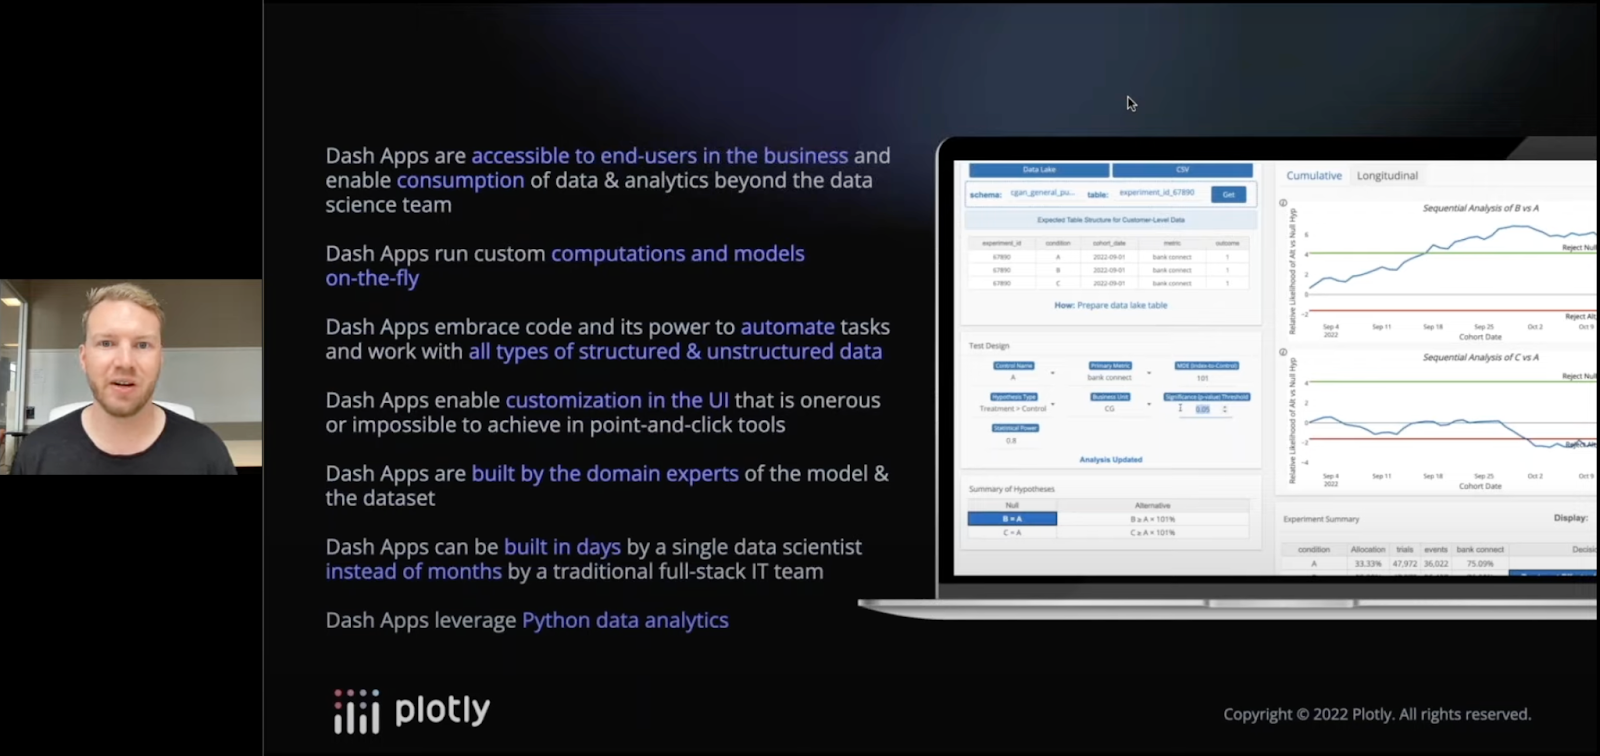
Our mission is to enable every organization to build and deploy Dash apps. Dash apps go beyond BI and spreadsheets by embracing Python for advanced analytics and unparalleled flexibility.
What we found over the last 5 years is that the platform for managing these applications is equally vital as the application framework itself. An app that runs on localhost is nothing unless it’s running in production. For companies large and small, “production” means something! Think SSO login screens, memory limits, remote debugging, restricted network access, redundancy, massive data volume, and more.
Dash Enterprise 5.0 is our latest version of the platform. It brings dozens of new features like app co-ownership, SSO identity provider wizards, multi-node scaling, 25GB persistent filesystems, OIDC login screens, brand-new app management UI, and more. It’s the culmination of 5 years of development, hundreds of on-premises customer installations, and thousands of apps running in production environments around the world. Huge thank you to all of our customers for your support and feedback over the years.
Watch the Dash Enterprise 5.0 launch video.
App of the Month
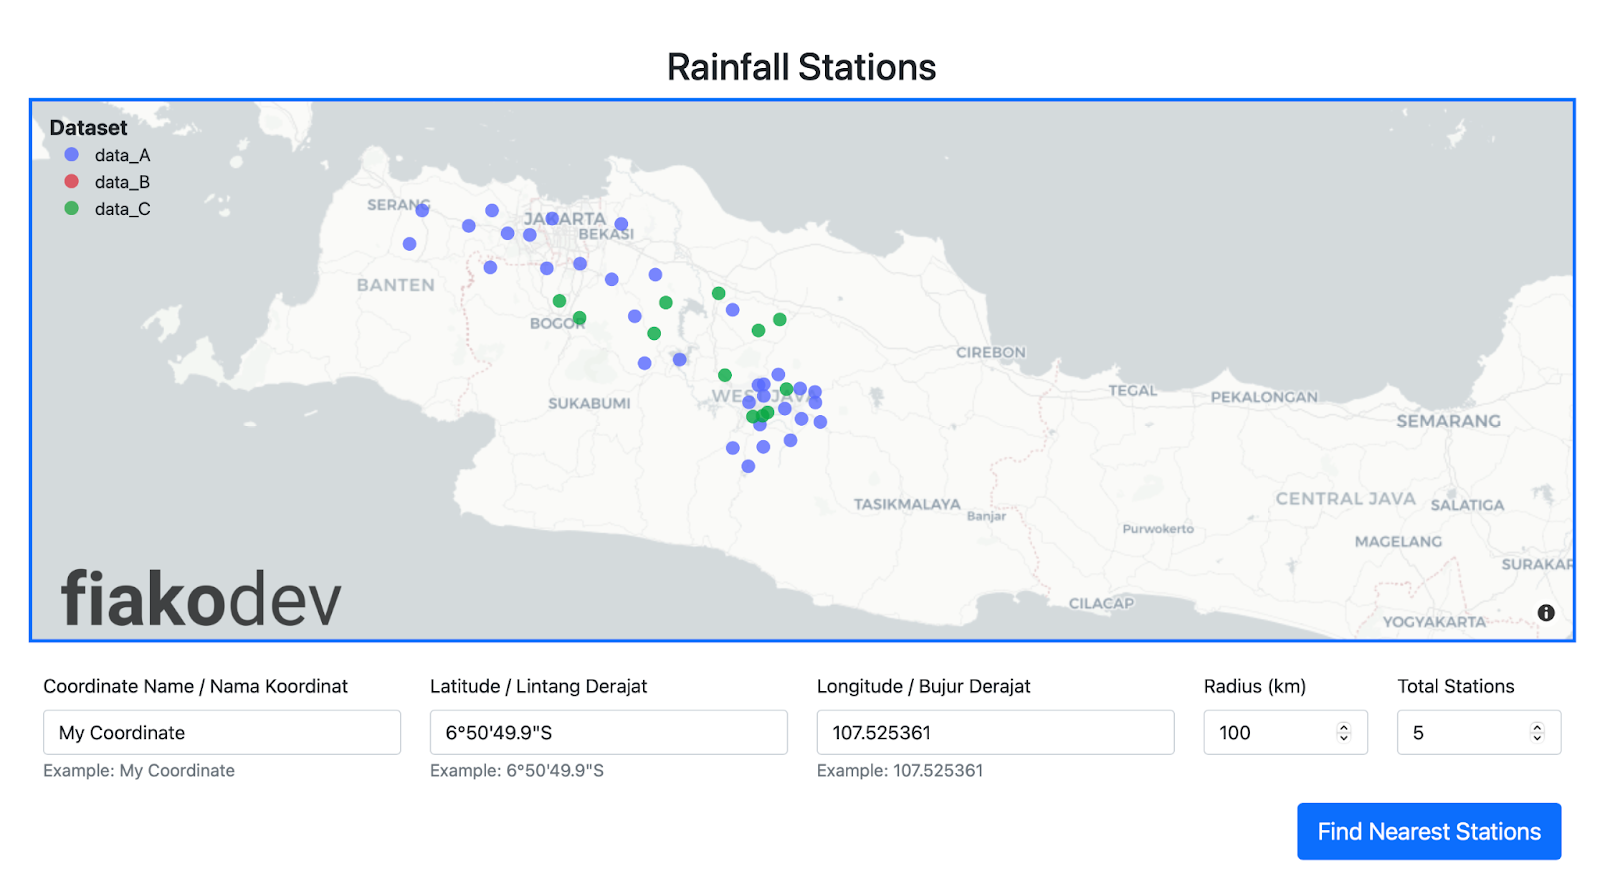
A few incredible Rainfall Apps were shared by @taruma on the Community Forum, which is a great example of how Dash takes you beyond BI:
![]() Live data from an rainfall IOT sensor API
Live data from an rainfall IOT sensor API
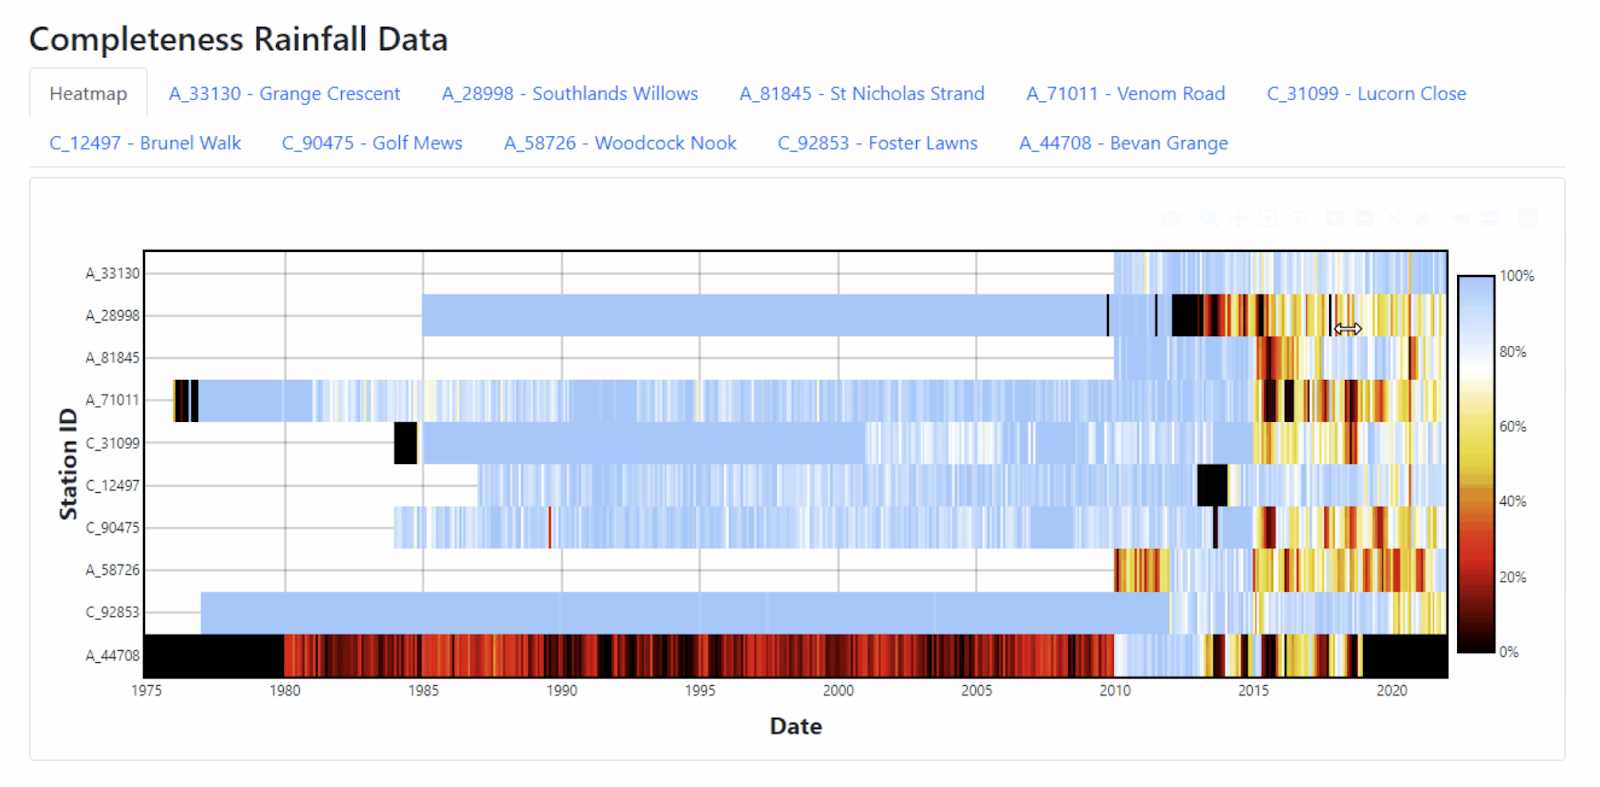
![]() Deep statistical analysis & scientific modeling
Deep statistical analysis & scientific modeling
![]() Ability to run simulations on-the-fly
Ability to run simulations on-the-fly
![]() Excellent design
Excellent design
![]() Great use of multi-page + multi-tab
Great use of multi-page + multi-tab
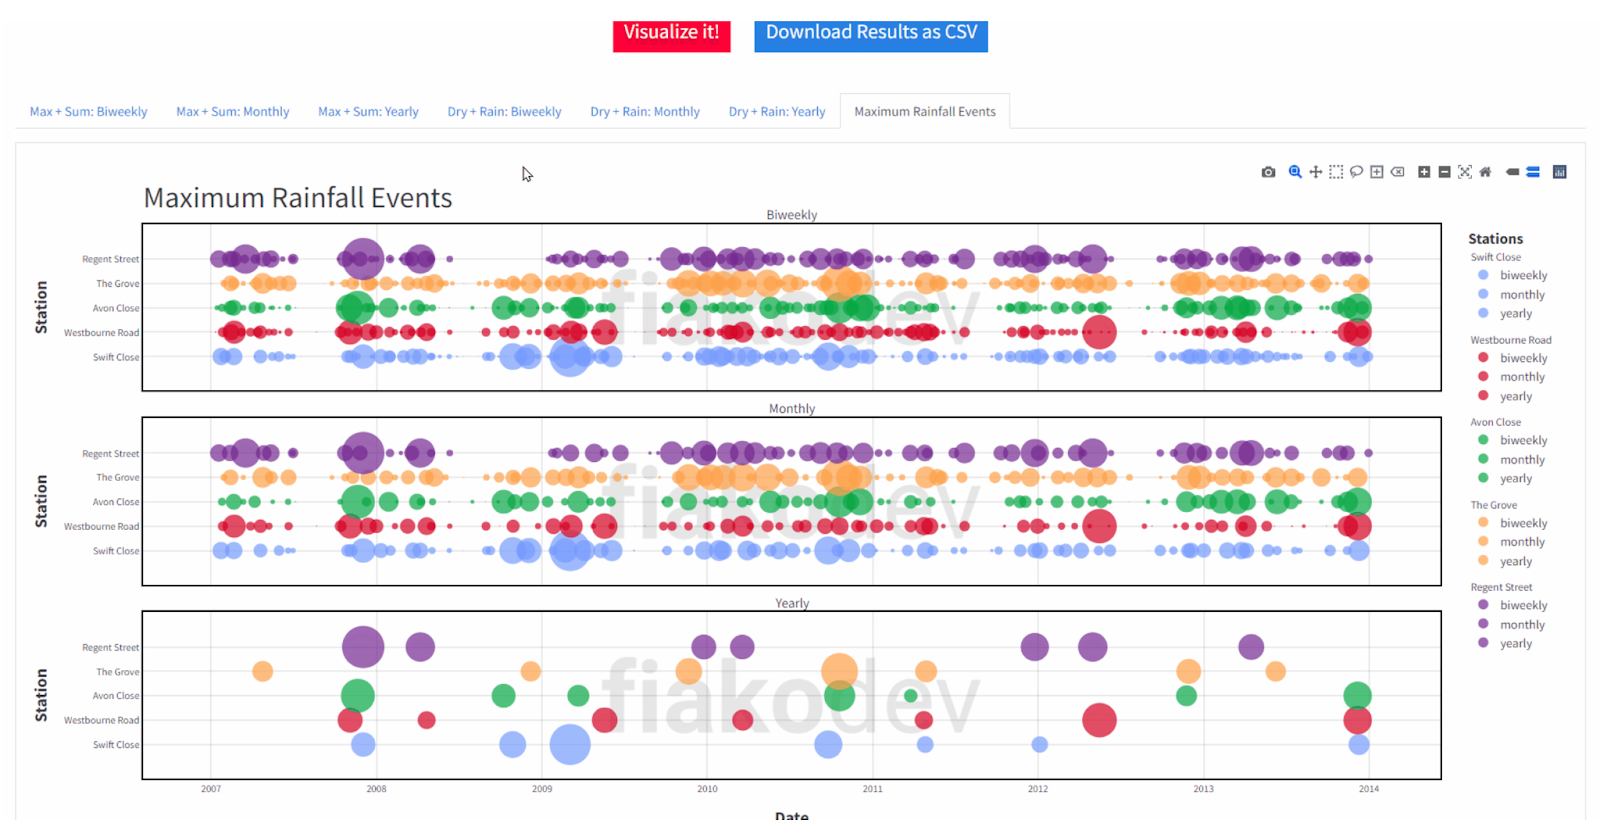
![]() Mix of scientific + geospatial + simple but effective bubble & bar charts
Mix of scientific + geospatial + simple but effective bubble & bar charts
![]() ONE PERSON made this!
ONE PERSON made this!
See the apps: Rainfall Stations Explorer, Rainfall Data Explorer, Frequency Analysis in Hydrology.
See more Dash apps or share your own in the Community Forum’s Show and Tell tag. If you would like your app to be considered for the next edition of the Dash Club newsletter, please message Adam on the Forum.
—
Component of the Month
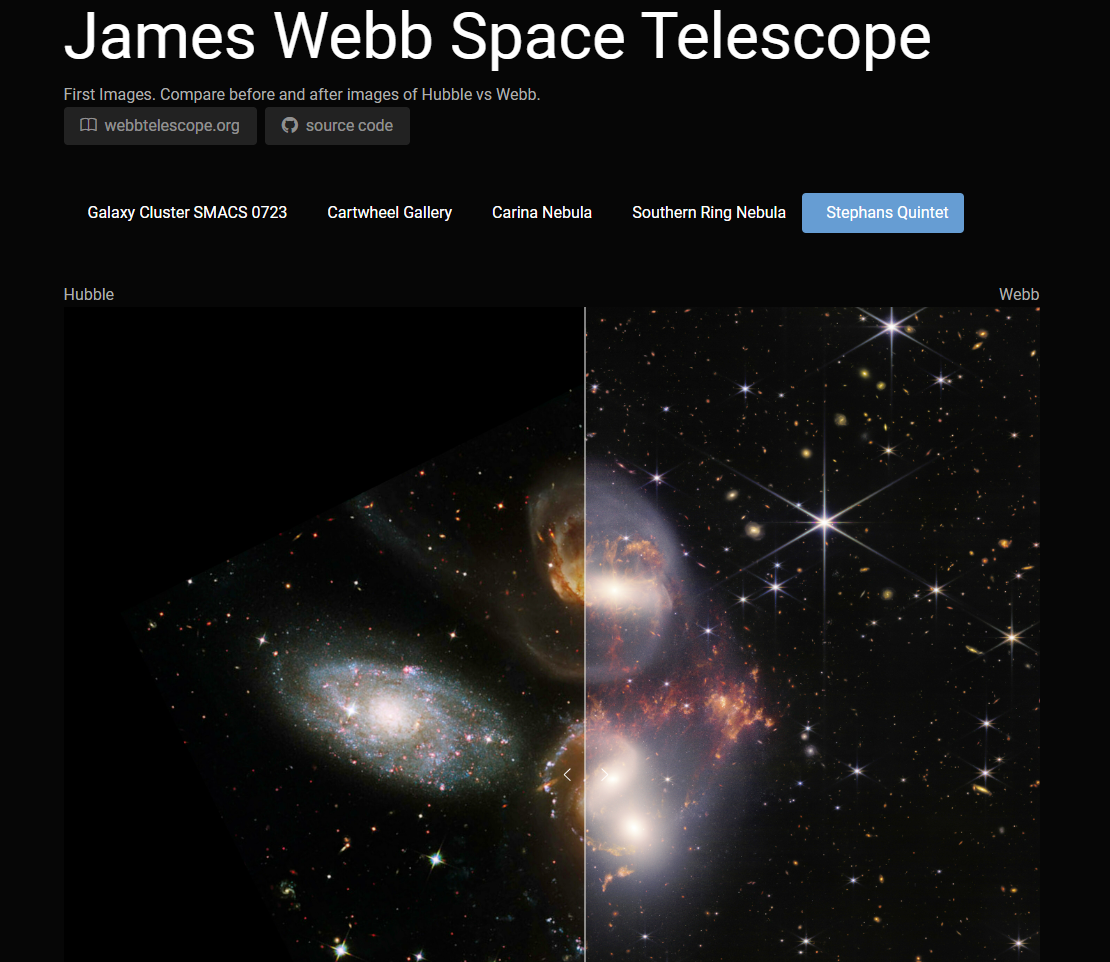
Long-time community member, Emil, has created a powerful Dash library called Dash Extensions, which enhances the capabilities of Dash. One of the components of Dash Extensions is the BeforeAfter component.
The BeforeAfter is a light wrapper of an image-comparison-slider, which makes it easy to highlight differences between two images. In fact, to visualize the richness behind the BeforeAfter component, Ann Marie, recently made a Dash app that highlights the first James Webb Telescope images.
Thank you, Emil and Ann Marie, for creating and sharing the BeforeAfter component with the Plotly Community.
Visit our community components index to see more components! And join our component-builder community by creating and sharing your own Community Components.
—
Coming Soon in Dash - Partial Property Updates
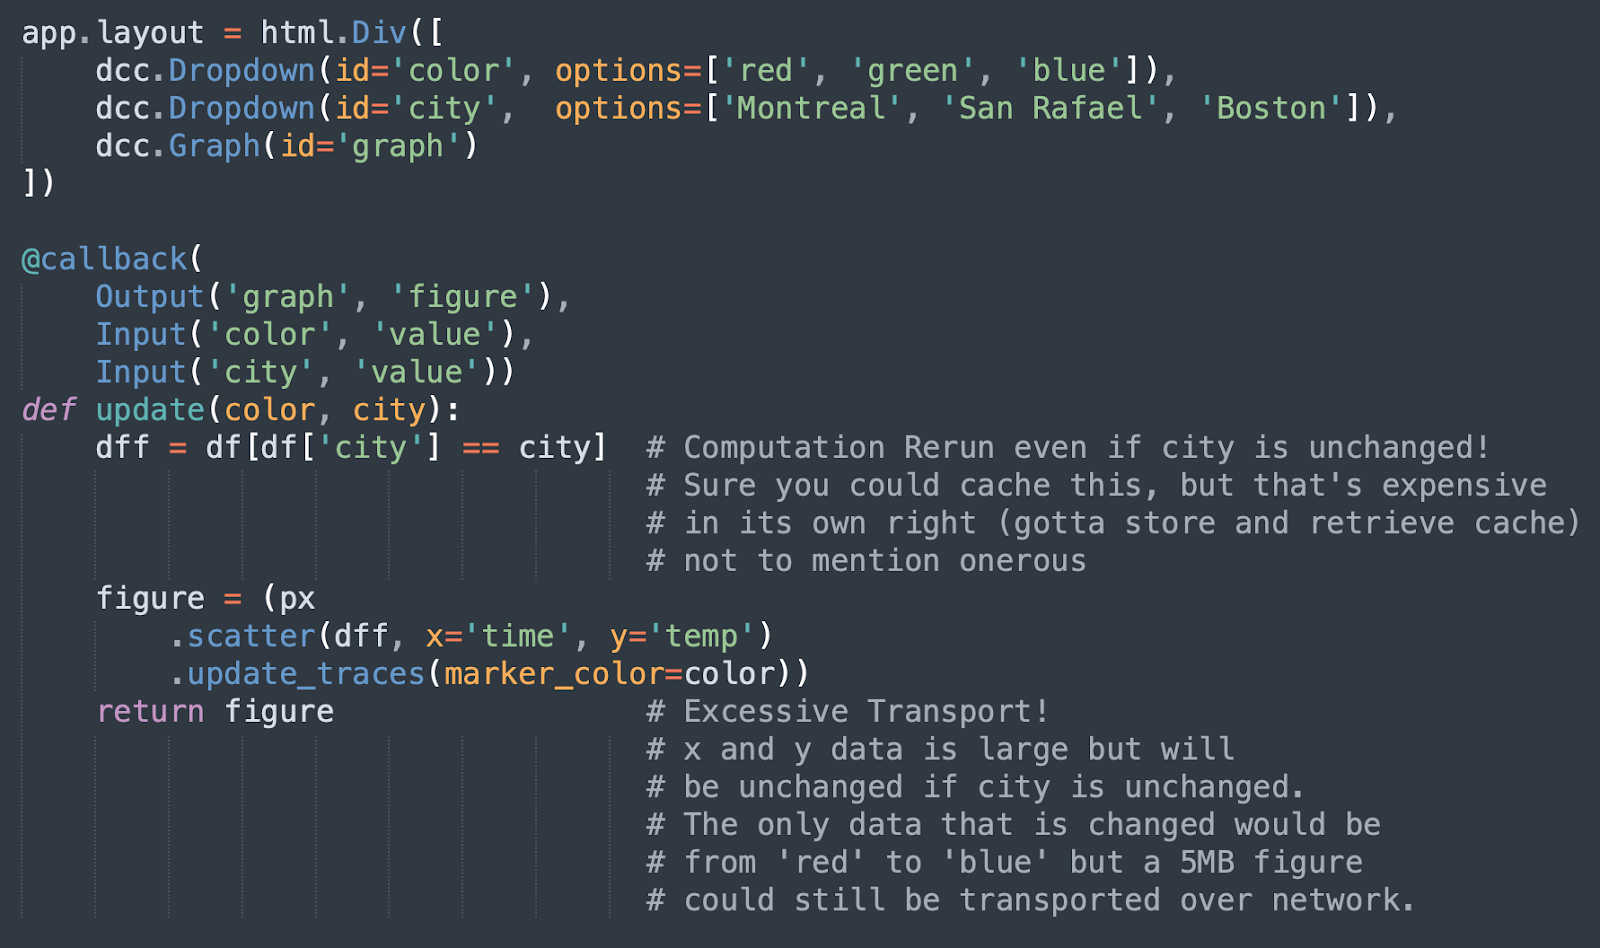
We’re currently working on “partial property updates” for Dash components and callbacks. This feature can improve the performance of your Dash apps by preventing unnecessary computation, data fetching, and reducing the amount of data that travels over the network between the browser and the server.
UI interactions that update a small part of a component can be expensive:
- Computation Rerun - Computations for adjacent inputs need to be rerun.
- Excessive Transport - The entire component’s property data structure needs to be sent over the wire even if only a small part of the data structure is changing.
For example, consider a graph that’s controlled by two dropdowns:
If the user could perform partial property updates, then each user interaction could partially update the property reducing the computational overhead and transport cost:
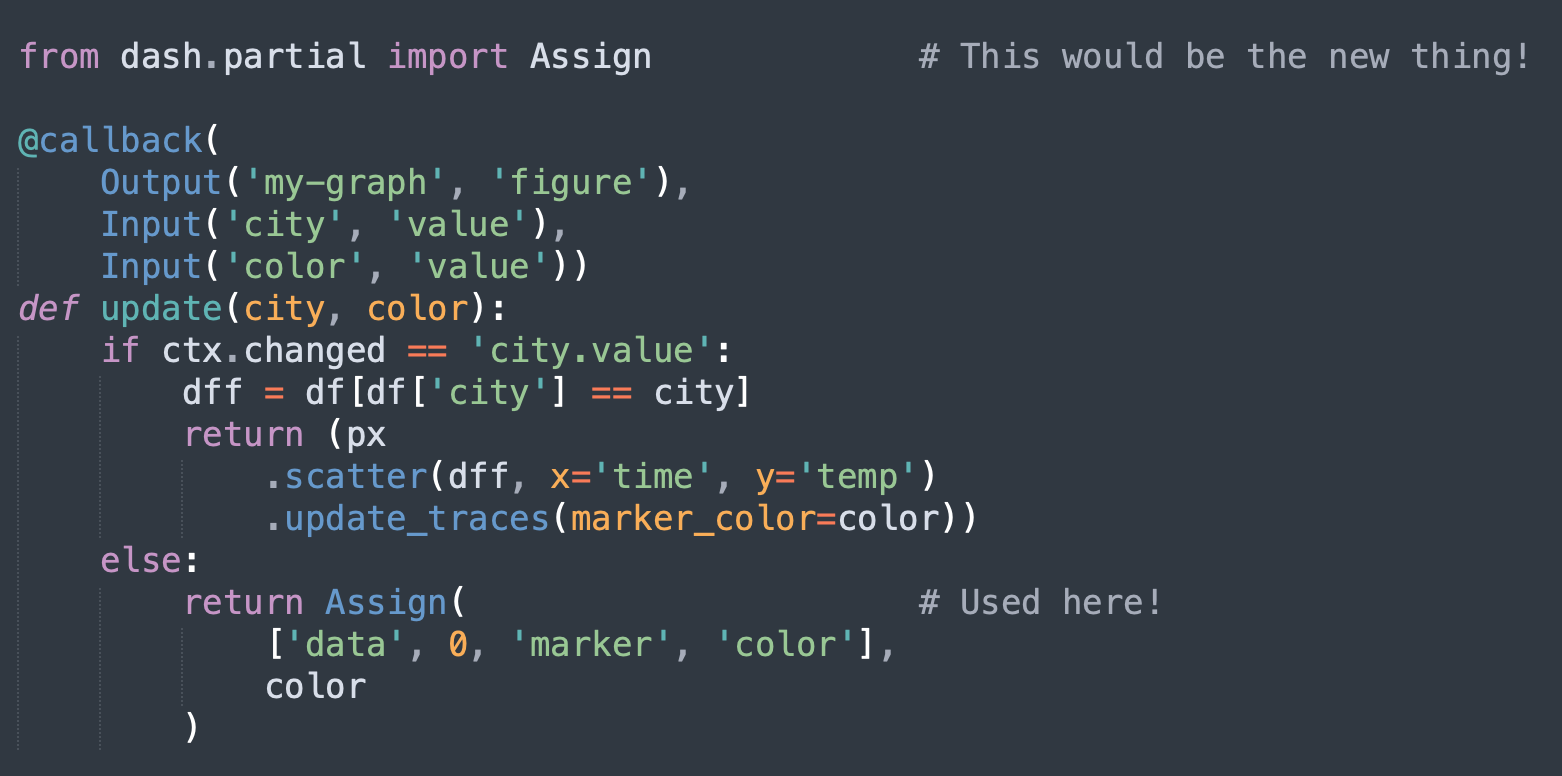
Some other use cases include appending data to a figure, a table, or even a div (think showing log messages).
Exciting stuff! The syntax is still subject to change and we’ll share what we’ve built in the Forum’s announcements. Ideas? Respond to this email ![]()
—
Hiring Technical Product Managers
Speaking of new features…We’re expanding our technical product management team at Plotly, and we love to hire Dash experts from the community. PMs work directly with myself, our engineering team, and our customer base to design and prototype the next new features for Dash Open Source and Dash Enterprise. We operate out of the USA, Canada, and the UK. Check out the job posting and let us know in your email if you found out about the position from Dash Club.
—
Autumn Community App Challenge Winners
Thank you all for participating in the Autumn App-Building Challenge. The usage of Dash Pages was phenomenal.
A group of Plotly staff judges reviewed and studied each app, and voted for the top three app winners. And the winners are…![]()
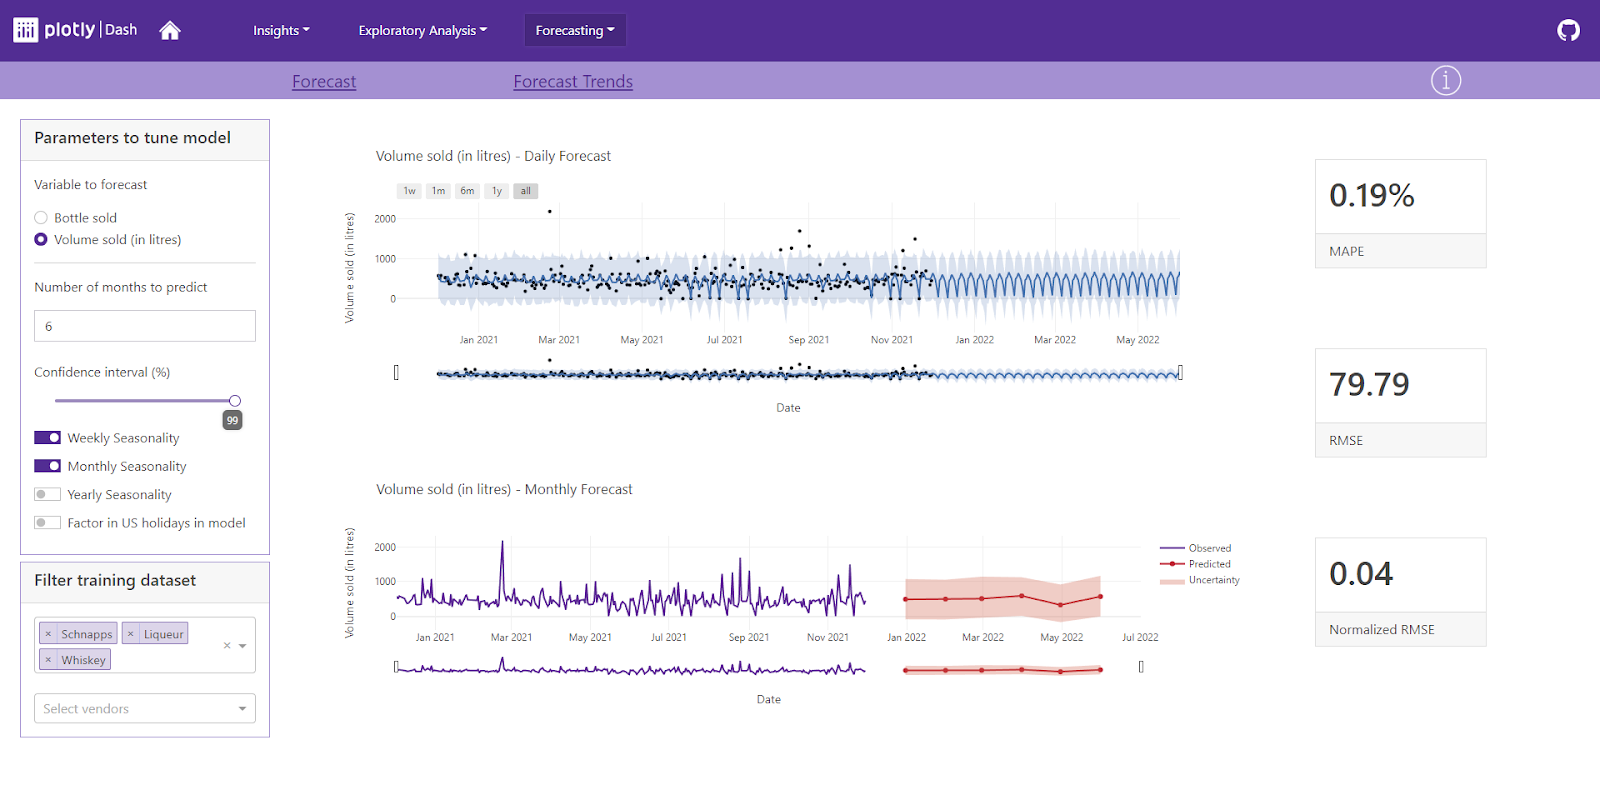
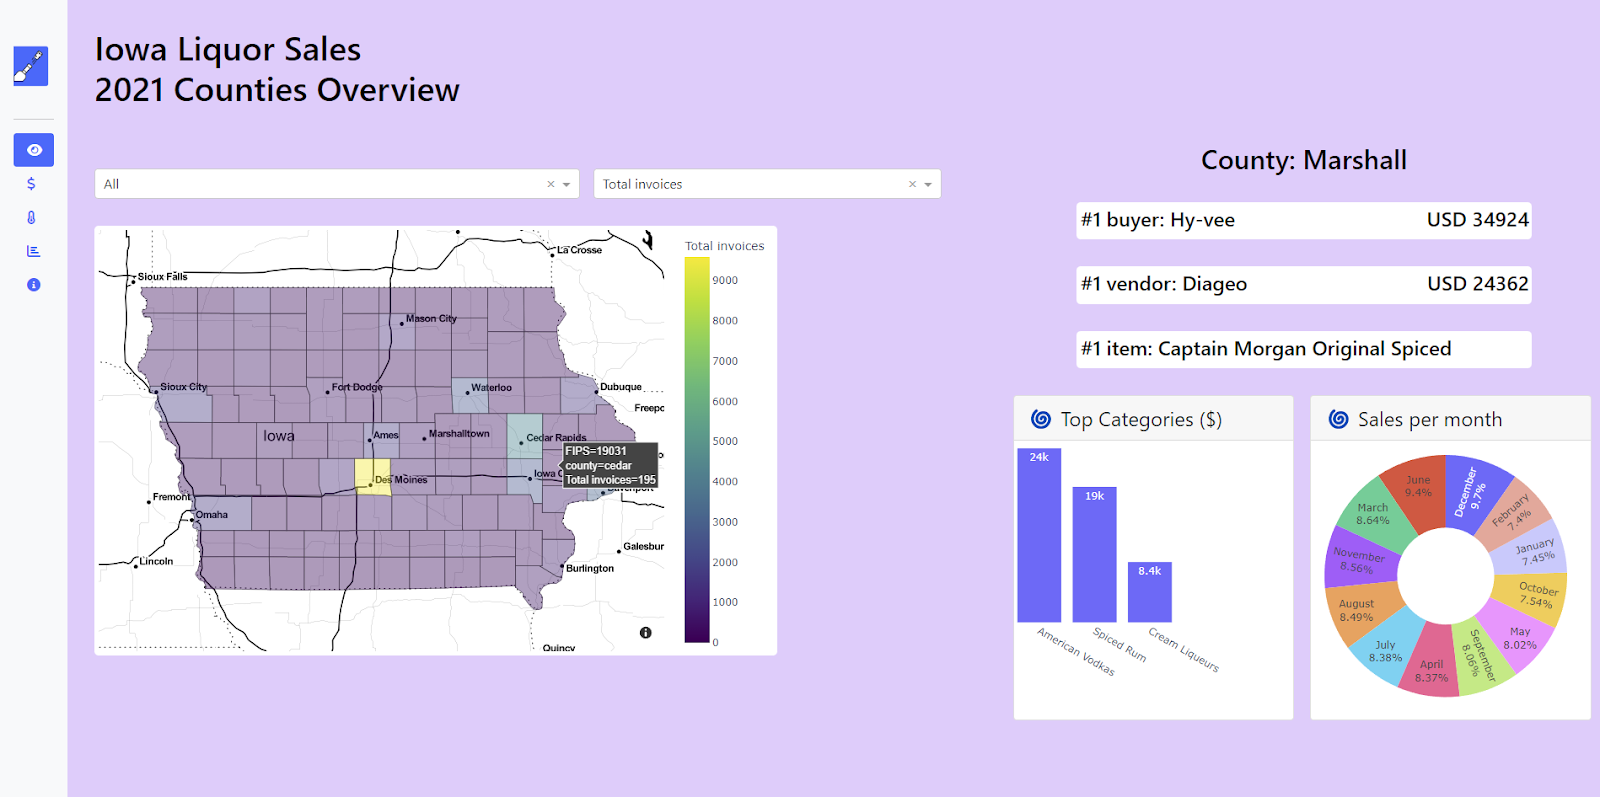
![]() Liquor Dash App, created by Deepa, with the following code.
Liquor Dash App, created by Deepa, with the following code.
Deepa’s app took first place for a well-done design that is easy to navigate while being very pleasing to the eye. The forecasting page was a creative addition to the app. But what sets it apart is the fact that it has many data exploration opportunities and it is so user-friendly.
- Deep’s app was not deployed to the web. If you would like to run it, Deep recommends creating a conda virtual environment and installing the necessary packages.
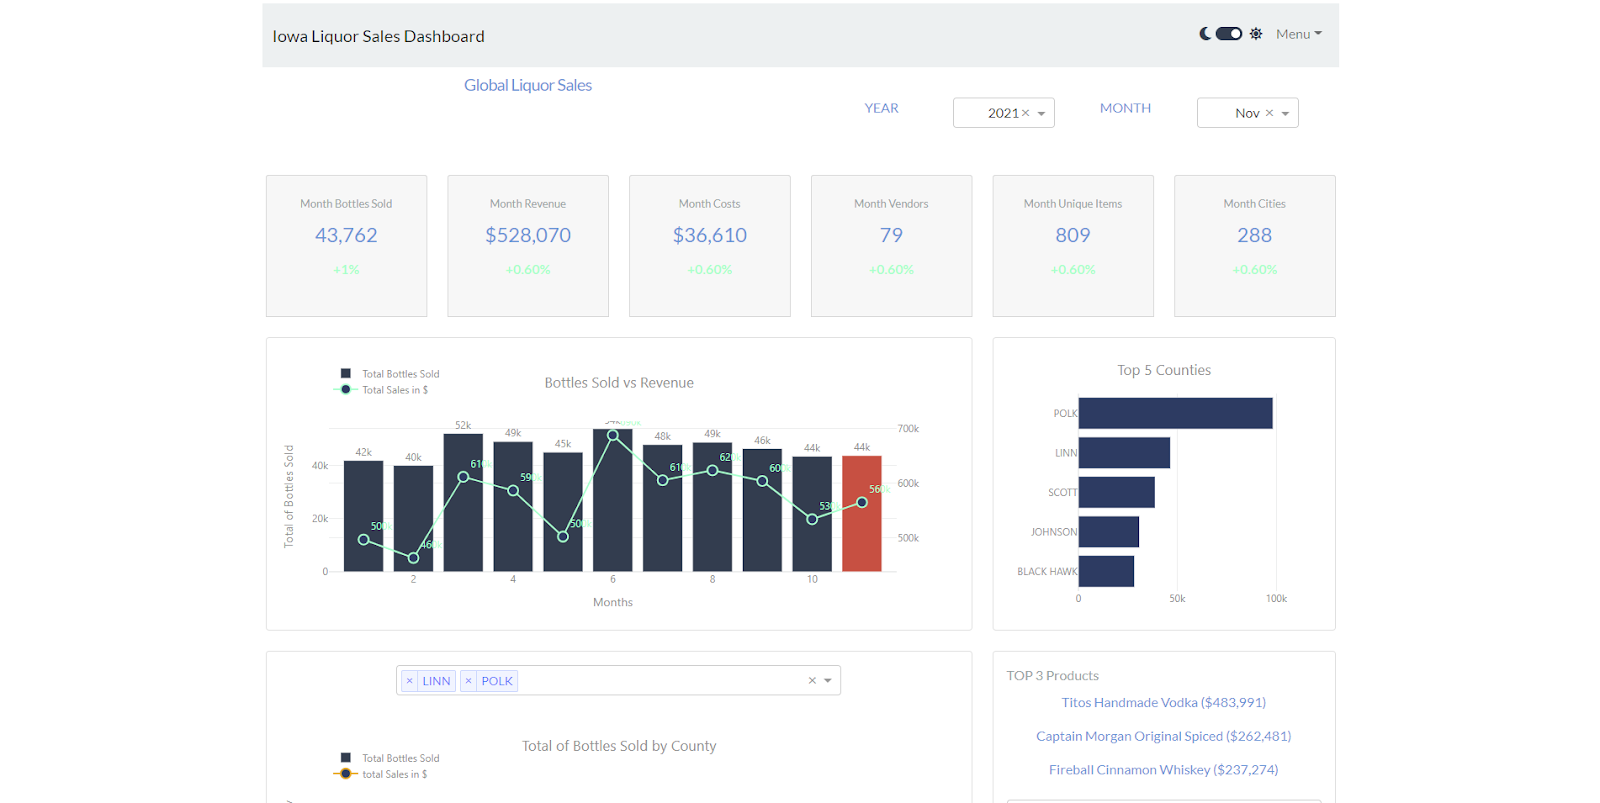
![]() Liquor Dash App, created by Julie, with the following code.
Liquor Dash App, created by Julie, with the following code.
Julie’s app was the runner app because of the great use of Pages. Lots of content was well-divided using the Pages framework. It also offers many ways to explore the data and has creative use of other features within the pages, such as tabs, different types of graph, and the option to drag and drop cards and charts.
![]() Liquor Dash App, created by Joao, with the following code.
Liquor Dash App, created by Joao, with the following code.
We would like to reiterate our appreciation for the apps submitted by the other community members: app by Somesh, app by Tran K., and app by AIMPED.
The winning community members will receive a package of this season’s Plotly swag, as well as financial awards.
—
Holiday Community App Challenge
‘Tis the season for wish lists and add-to-carts! With the upcoming holidays, consumers are looking to pick the best gifts, and retailers are trying their hardest to attract them.
We challenge the Plotly Community to build the most impressive customer segmentation data app to better understand consumer behavior.
The customer churn data was provided by IBM to solve business problems and predict customer churn for a fictional telecommunication company. See the data description.
To enter the Community Challenge, please download the dataset, create an app, and share it by replying to this Forum topic by midnight Saturday, January 14. Please share your code and a link to the deployed app if possible.
The winning apps will be judged according to the following categories:
- Ability to provide insight on the relationship between churn and customers’ characteristics
- App Design
- Data exploration and data analysis routines (e.g. numerical methods, machine learning, prediction, classification, optimization)
The winners will be announced in the next Dash Club dispatch. The app winners will receive a Plotly New Years package as well as:
![]() $125 USD
$125 USD
![]() $75 USD
$75 USD
![]() $50 USD
$50 USD
For any questions, feel free to reply to the Forum topic or email Adam at adam@plot.ly.
—
Deploy Dash Apps to the Web with Render
As most of you have heard by now, Heroku ended its free tier service on November 28. After conducting research for viable no-cost replacements, we have decided to recommend Render as a platform for deploying Dash apps to the web.
Here’s a quick video on how to deploy a Dash app, using Render.
Thank you POBonin for putting this video together and supporting the community in sharing their apps.
–
The Book of Dash
From basic components to advanced layouts, learn how to display data in effective, usable, and elegant ways in this new book co-written by myself (Adam Schroeder!) and community member, Ann Marie Ward.
The Book of Dash offers a crash course on Python, PyCharm, and pandas, as well as advanced layouts and graphs, machine learning fundamentals, and more. ![]()
Download one chapter and receive a 25% discount code for the complete No Starch Press book.
—
80 Minimal Code Examples
If you’re interested in learning Dash or would like to access dozens of example code snippets, check out the community-driven Dash Example Index.
With a list of over 80 code snippets that combine Dash components with Plotly graphs, this is a great tool to explore the rich features of Dash.
We have started incorporating the Dash Example Index into the Dash docs as well. Multiple Dash Core Components refer to the Example Index for more learning opportunities, such as the Dropdown and the Input, among many others.
This project has been a community effort, months in the making. Thank you to all the community members who have contributed their time, Dash skills, and wonderful examples to this initiative.
@AnnMarieW @cepel @Emil @Milan @POBonin @someshfengde @stu @Sangeetha @RodrigoV
Our ultimate goal is to showcase 100 examples. If you’re interested in joining the efforts and contributing your own app snippet, check out the contributing guide or feel free to message me at adam@plot.ly.
—
Things Happen
![]() I (Chris!) was on the Business of Data Podcast, sharing the challenges and benefits of empowering data scientists with data visualization and data apps.
I (Chris!) was on the Business of Data Podcast, sharing the challenges and benefits of empowering data scientists with data visualization and data apps.
![]() Our very own Alex Hsu facilitated a webinar on Dash Best Practices. Watch the video!
Our very own Alex Hsu facilitated a webinar on Dash Best Practices. Watch the video!
![]() Plotly is hiring: Intermediate Backend Engineer, Sales Engineer, and Technical Product Manager.
Plotly is hiring: Intermediate Backend Engineer, Sales Engineer, and Technical Product Manager.
![]() Job postings with Dash skills needed.
Job postings with Dash skills needed.
![]() Learn Dash in Portuguese with Anibal’s YouTube channel.
Learn Dash in Portuguese with Anibal’s YouTube channel.
![]() Learn Dash in Russian with Anton’s YouTube channel.
Learn Dash in Russian with Anton’s YouTube channel.
![]() Community member, Rodrigo from Brazil, recorded and shared a tutorial on using a datepicker in a Dash App.
Community member, Rodrigo from Brazil, recorded and shared a tutorial on using a datepicker in a Dash App.
![]() Community member, Waleed, built and contributed a new dash-chartjs component, sharing his creation on the Forum.
Community member, Waleed, built and contributed a new dash-chartjs component, sharing his creation on the Forum.
![]() Community member, Najeem, built and contributed a new Dash components: a node editor for Dash, called flowfunc, sharing his creation on the Forum.
Community member, Najeem, built and contributed a new Dash components: a node editor for Dash, called flowfunc, sharing his creation on the Forum.
![]() Built by our talented Plotly team, Dave & Dan, check out the Plotly & Dash 500 Index, showcasing the top 500 real-world analytics Dash apps and projects.
Built by our talented Plotly team, Dave & Dan, check out the Plotly & Dash 500 Index, showcasing the top 500 real-world analytics Dash apps and projects.
![]() Community member, Tim, built his awesome Bourbon Analytics app.
Community member, Tim, built his awesome Bourbon Analytics app.
![]() Community member, Arne, shared an awesome example of an app with circular callbacks in this Forum post.
Community member, Arne, shared an awesome example of an app with circular callbacks in this Forum post.
![]() Community member, Ann Marie, wrote a very useful tutorial on how to use Bootstrap utilities with Dash.
Community member, Ann Marie, wrote a very useful tutorial on how to use Bootstrap utilities with Dash.
![]() Celebrating our top community contributors in November.
Celebrating our top community contributors in November.
—
Have a great rest of your week –
Chris & Adam