Dear All,
Is it possible to add series of text under the gantt chart created in Phyton like the attached picture with manual text series ilustration at bottom.
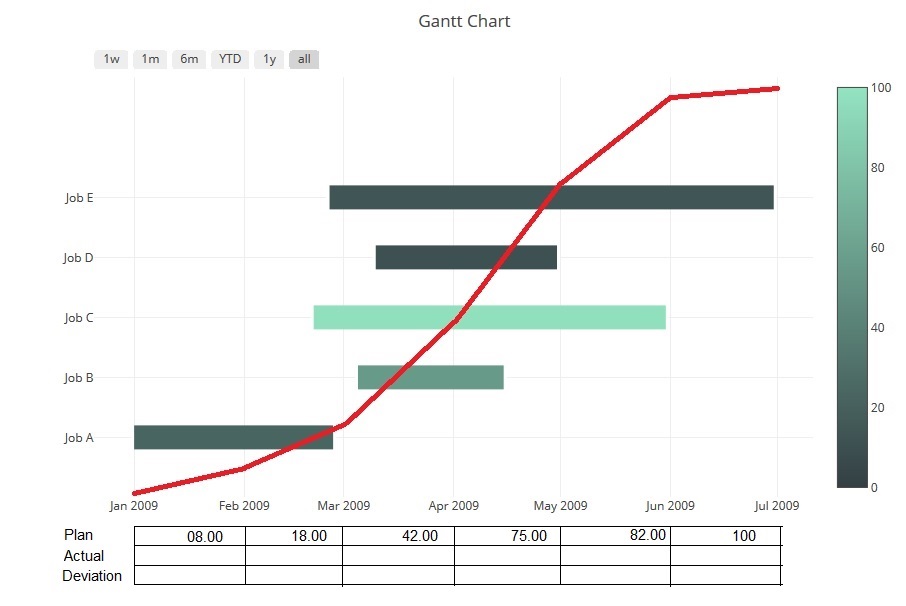
Please advice on how to do that in phyton, with link of help or samples
Thank you so much.
Best regards,
Wayan S