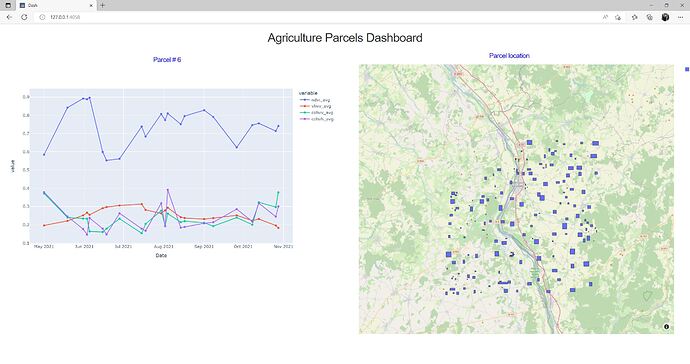
Hi, I am new to this plotly dash environment. I am trying to build a dashboard, where I have two main components
1: Agriculture parcels (blue boxes in right side in map)
2: Statistics of each parcel.
My goal is when I click on any parcel its graph should be updated accordingly. Currently both map and graph are separate, I want to join them for this purpose. The statistics data is being fetched from API. for every parcel I have a unique API (only parcel number is changed in API). I have written the function to change the API automatically when the the parcel number is given in input. The parcels have this unique number linked with them in map
Can someone please guide how can I have this feature that I click on parcel, it will give that unique ID of parcel to API which then fetches the data and plot its graph accordingly.
I am attaching below my code for better understanding of whats happening.
CODE
#importing libraries
import dash
from dash import dcc
from dash import html
import numpy as np
import plotly.graph_objs as go
from dash import Dash, dcc, html, Input, Output
import plotly.express as px
import pandas as pd
import json
from shapely.geometry import shape
import requests


#function to update API, currently taking input from user ideally take input from the click of parcel

def updated_apis():
    foreign = input('enter parcel foreign id')
    s1_time_series_url_p6 = 'https://demodev2.kappazeta.ee/ard_api_demo/v1/time_series/s1?limit_to_rasters=true&parcel_foreign_id=6&properties=parcel_foreign_id%2Cs1product_end_time%2Cs1product_ron%2Ccohvh_avg%2Ccohvv_avg%2Cvhvv_avg'
    s2_time_series_url_p6 = 'https://demodev2.kappazeta.ee/ard_api_demo/v1/time_series/s2?limit_to_rasters=true&parcel_foreign_id=6&properties=parcel_foreign_id%2Cs2product_start_time%2Cs2product_ron%2Cndvi_avg'
    position = 101
    s1_time_series_url_p6 = s1_time_series_url_p6[:position] + foreign + s1_time_series_url_p6[position+1:]
    s2_time_series_url_p6 = s2_time_series_url_p6[:position] + foreign + s2_time_series_url_p6[position+1:]
    r_s1_time_series_p6 = requests.get(s1_time_series_url_p6)
    r_s2_time_series_p6 = requests.get(s2_time_series_url_p6)
    json_s1_time_series_p6 = r_s1_time_series_p6.json()
    json_s2_time_series_p6 = r_s2_time_series_p6.json()
    df_s1_time_series_p6 = pd.DataFrame(json_s1_time_series_p6['s1_time_series'])
    df_s2_time_series_p6 = pd.DataFrame(json_s2_time_series_p6['s2_time_series'])
    df_s2_time_series_p6.s2product_start_time=df_s2_time_series_p6.s2product_start_time.str[0:11]
    df_s1_time_series_p6.s1product_end_time=df_s1_time_series_p6.s1product_end_time.str[0:11]
    dfinal_p6 = df_s1_time_series_p6.merge(df_s2_time_series_p6, how='inner', left_on='s1product_end_time', right_on='s2product_start_time')
    cols_p6 = ['parcel_foreign_id_x', 's1product_ron','parcel_foreign_id_y','s2product_ron']
    dfinal_p6[cols_p6] = dfinal_p6[cols_p6].apply(pd.to_numeric, errors='coerce', axis=1)
    return dfinal_p6


#parcels and map

parcels=json.load(open ("C:/Users/AbdullahToqeer/Desktop/dashboard data/parcel_n.geojson"))
for feature in parcels['features']:
    feature['id'] = feature['properties']['parcel_id']
df = pd.read_csv('C:/Users/AbdullahToqeer/Downloads/df_n.csv')
fig = px.choropleth_mapbox (df, geojson=parcels, locations="parcel ID", featureidkey="id", zoom=9.5, center = {"lat": 47.3824, "lon": 2.9253}, height=800, width=1000)
fig.update_layout(mapbox_style="open-street-map")
fig.update_layout(margin={"r":0,"t":0,"l":0,"b":0})
fig.show()


external_stylesheets = ['https://codepen.io/chriddyp/pen/bWLwgP.css']
app = dash.Dash(__name__, external_stylesheets=external_stylesheets)

while True:
    graph = updated_apis()
    app.layout = html.Div([
    html.H2('Agriculture Parcels Dashboard', style={'textAlign': 'center'}),

    html.Div([
        html.Div([
            html.H4('Parcel # 6', style={'textAlign': 'center','color': 'blue', 'fontSize': 20}),
            dcc.Graph(
        id='scatter_chart',
        figure=px.line(graph,x="s1product_end_time", y=["ndvi_avg", "vhvv_avg","cohvv_avg","cohvh_avg"],markers=True, width=1000,height=600,
                      labels={"s1product_end_time": "Date"}))], className="six columns"),


    html.Div([
            html.H4('Parcel location', style={'textAlign': 'center','color': 'blue', 'fontSize': 20}),
            dcc.Graph(figure=fig, className="six columns")

                      ])
                      ])
                      ])

    if __name__ == '__main__':
        app.run_server(port=4060)
