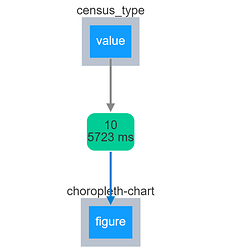
I’ve tried StackOverflow and someone mentioned I try here. I have a dataframe and I can make a Choropleth map from each individual data column (% Population Change and Unemployment Rate). I’d like to connect a dropdown to the graph. Like I said, I can create a static Dash Choropleth map from one of the column, but can’t connect the dropdown to the graph.
My stackoverflow question: python - How to connect a Plotly Dash dropdown to a Choropleth map? - Stack Overflow
There’s a bunch of code before to create this DataFrame. Here’s the first five lines.
FIPS       Geographic Area State  4/1/2010 Census  4/1/2020 Census  % Population Change  Unemployment Rate
0   22001                Acadia    LA            61787            57576            -6.815350                3.6
1   22003                 Allen    LA            25747            22750           -11.640191                4.0
2   22005             Ascension    LA           107215           126500            17.987222                2.9
3   22007            Assumption    LA            23416            21039           -10.151179                5.3
4   22009             Avoyelles    LA            42071            39693            -5.652350                3.7
And here’s the rest of the code.
import pandas as pd
import requests
from bs4 import BeautifulSoup
from urllib.request import urlopen
import json
import dash
import plotly.graph_objs as go
import dash_html_components as html
import dash_core_components as dcc
from dash.dependencies import Input, Output
import plotly.express as px


def display_chart():

    # There's a bunch of code before this, but the dataframe works fine on separate Choropleth maps. I would like an interactive map using the drop down.
    df = pd.merge(df4, df5, on="Geographic Area", how='inner')

    # print(df) The output is printed in this forum question.

    app = dash.Dash()

    app.layout = html.Div([
        html.H2('Financial Genome Project'),
        dcc.Dropdown(
            id='census_type',
            options=[{"label": x, "value": x}
                     for x in df.columns[5:]],
            value=df.columns[0],
            clearable=False,
            style={'width': 300},
            placeholder="Select a census data type"
        ),
        html.Hr(),
        dcc.Graph(id="choropleth-chart"),
    ])

    @app.callback(
        Output("choropleth-chart", "figure"),
        [Input("census_type", "value")]
    )
    def display_choropleth(census_type):
        fig = px.choropleth(df, geojson=counties,
                            locations='FIPS',
                            color=census_type,
                            color_continuous_scale="rdylgn_r",
                            range_color=(0, 8),
                            scope="usa",
                            hover_name='Geographic Area',
                            # labels={'% Change': 'Population % Change'}
                            )

        # fig.update_layout(margin={"r": 0, "t": 0, "l": 0, "b": 0})
        fig.update_geos(fitbounds='locations', visible=False)
        return fig

    app.run_server(debug=True)


display_chart()
This is what I get. No Choropleth map and callback errors.

