I would like to make a line plot where the color of the line can vary based on another parameter. It works, but Plotly connects the gaps, which I don’t want. I tried setting connectgaps=False, but that did not help. Here’s a very simple code and the associated output.
import numpy as np
import plotly.express as px

x = np.linspace(0, 4 * np.pi, 100)
y = np.sin(x)
c = np.digitize(y, [-1, -0.5, 0, 0.5, 1])
fig = px.line(x = x, y = y, color = c)
fig.update_traces(connectgaps = False)
fig.show()

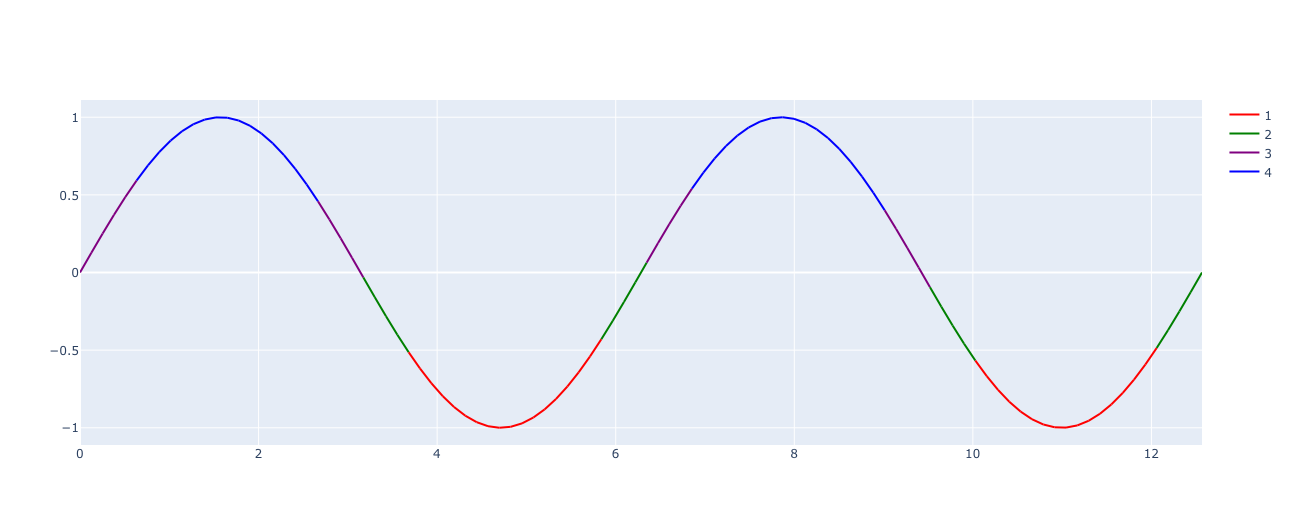
In my data, I can guarantee there are long contiguous segments that I want to be the same color. The only way I’ve found to do this is the identify all the segments and plot them individually. To be fair, this took like… 10 lines of code, and it’s probably even easier than that. But I feel like there’s probably a way to make Plotly do this; I just don’t know how. Here’s the result I really want:

And the gaps between the colors are perfectly fine. It’s sort of ambiguous what you would put there anyway. Would it be the previous color or the next color? Or something in-between? Either way, the gaps in my data would be tiny, so no one would even notice.
Thanks in advance!
–Bill