I am developing a prototype application in plotly dash and one feature allows overhead viewing of groundwater plume. I import interpolated plume data as a geojson file which I convert to a geopandas dataframe and then plot using the plotly express choropleth_mapbox function. The image appears correctly and the code works in a jupyter notebook.
px.set_mapbox_access_token('your-token-here')

year = 2012
with open('data\\Shallow_%i.geojson' % (year)) as f:
    gj = geoload(f)

gj_object = geoloads(gj)
shgdf = gpd.GeoDataFrame.from_features(gj_object['features'])
shgdf = shgdf.loc[~shgdf.geometry.is_empty]
cmap = {
    list(d.values())[0]: list(d.values())[1]
    for d in shgdf.loc[:, ["title", "fill"]].apply(dict, axis=1).tolist()
}
newFig = px.choropleth_mapbox(
    shgdf,
    geojson=shgdf.geometry,
    locations=shgdf.index,
    color="title",
    color_discrete_map=cmap,
    center={"lat": 39.1266, "lon": -75.4647},
    opacity=.5,
    mapbox_style='satellite',
    zoom=12
)

newFig.show()
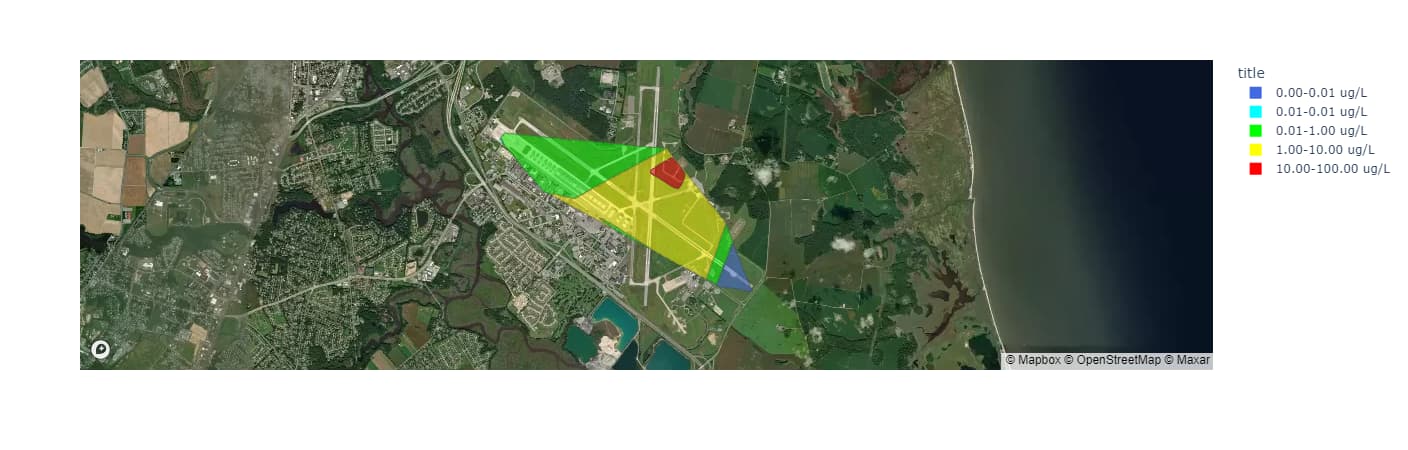
When I try to port it over to a simple dash application non of the plots display anything. I have uploaded the raw data (uninterpolated, individual groundwater concentration) and plot using scatter_mapbox and the same code works just fine. I am very stuck and not sure what else to try. I have noticed similar posts on this issue but none of them could resolve my problem. Image current dash app and the code are below. Thank you in advance.

from datetime import date
from datetime import datetime
import datetime as dt

import geopandas as gpd
from geojson import load, loads

import plotly.express as px

import dash
from dash.dependencies import Input, Output
import dash_core_components as dcc
import dash_html_components as html
from dash import callback


#--- Application initialization ---#
# Initialize the application, set to device width
app = dash.Dash(
    __name__, meta_tags=[{"name": "viewport", "content": "width=device-width"}],
)

# Set application title and start a local server for the application
app.title = "Working Groundwater discharge tab"
server = app.server

# Create a layout for the dashboard, this is just a standard copy/pasted layout
layout = dict(
    autosize=True,
    automargin=True,
    margin=dict(l=30, r=30, b=20, t=40),
    hovermode="closest",
    plot_bgcolor="#F9F9F9",
    paper_bgcolor="#F9F9F9",
    legend=dict(font=dict(size=10), orientation="h"),
    title="Satellite View of DOVER AFB",
)

app.layout = html.Div([
    html.H1('Groundwater Discharge Offsite', style={'text-align':'center'}),
    dcc.Store(id='memory-output'),
    html.Div([
        html.H2("Select Soil or Water Data to View",
                style={'width': '30%', 'display': 'inline-block'}),
    ]),

    html.Div([
    dcc.Slider(min=2012,
                    max=int(date.today().year),
                    step=1,
                    value=2012,
                    marks={2012:'2012',2014:'2014',2016:'2016',2018:'2018',2020:'2020',2022:'2022'},
                    id='slider-gw',
                    tooltip={"placement": "bottom", "always_visible": True},),

    ],
    style={"display": "grid", "grid-template-columns": "100%"}),
        # Create a Dive for the date range
    html.Div([
    html.H2(
        "Shallow PFAS (Depth < 15 feet)",
        style={'width': '49%', 'display': 'inline-block', 'text-align':'center'}),
    html.H2(
        "Deep PFAS (Depth >= 15 feet)",
        style={'width': '49%', 'display': 'inline-block', 'text-align':'center'}),
    ],),
    # Create a div for the side by side graphs
    html.Div([
    dcc.Graph(
        id="shallowContour",
        style={'width': '49%', 'display': 'inline-block','float':'left'}),
    dcc.Graph(
        id="deepContour",
        style={'width': '49%', 'display': 'inline-block', 'float':'flex'}),
    ],),
],
)


app.title = "Working Groundwater Discharge Tab"
server = app.server
@app.callback(
    # By selecting graph "figure" as the tartet output element it automatically recognizes any plotly figure
    # Output and input commands recognize the source first and then the target second
    Output("shallowContour", "figure"),
    Output("deepContour", "figure"),
    Input('slider-gw', 'value'),
    )

def viewData(year):
    px.set_mapbox_access_token('your-token-here')

    # ---- Parse the shallow data ---- #
    print(year)
    with open('data\\Shallow_%i.geojson' % (year)) as f:
        gj = load(f)

    gj_object1 = loads(gj)
    shgdf = gpd.GeoDataFrame.from_features(gj_object1['features'])

    shgdf = shgdf.loc[~shgdf.geometry.is_empty]
    cmap = {
        list(d.values())[0]: list(d.values())[1]
        for d in shgdf.loc[:, ["title", "fill"]].apply(dict, axis=1).tolist()
    }
    shallowFig = px.choropleth_mapbox(
        shgdf,
        geojson=shgdf.geometry,
        locations=shgdf.index,
        color="title",
        color_discrete_map=cmap,
        opacity=.5,
        zoom=12,
        center={"lat": 39.1266, "lon": -75.4647},
    )


    # ---- Parse the deep data ---- #
    print(year)
    with open('data\\Deep_%i.geojson' % (year)) as f:
        gj = load(f)

    gj_object2 = loads(gj)
    dpgdf = gpd.GeoDataFrame.from_features(gj_object2['features'])


    dpgdf = dpgdf.loc[~dpgdf.geometry.is_empty]
    cmap = {
        list(d.values())[0]: list(d.values())[1]
        for d in dpgdf.loc[:, ["title", "fill"]].apply(dict, axis=1).tolist()
    }
    deepFig = px.choropleth_mapbox(
        dpgdf,
        geojson=dpgdf.geometry,
        locations=dpgdf.index,
        color="title",
        color_discrete_map=cmap,
        opacity=.5,
        zoom=12,
        center={"lat": 39.1266, "lon": -75.4647},
    )

    return shallowFig, deepFig

# Main
if __name__ == "__main__":
    app.run_server(debug=False)