Hi,
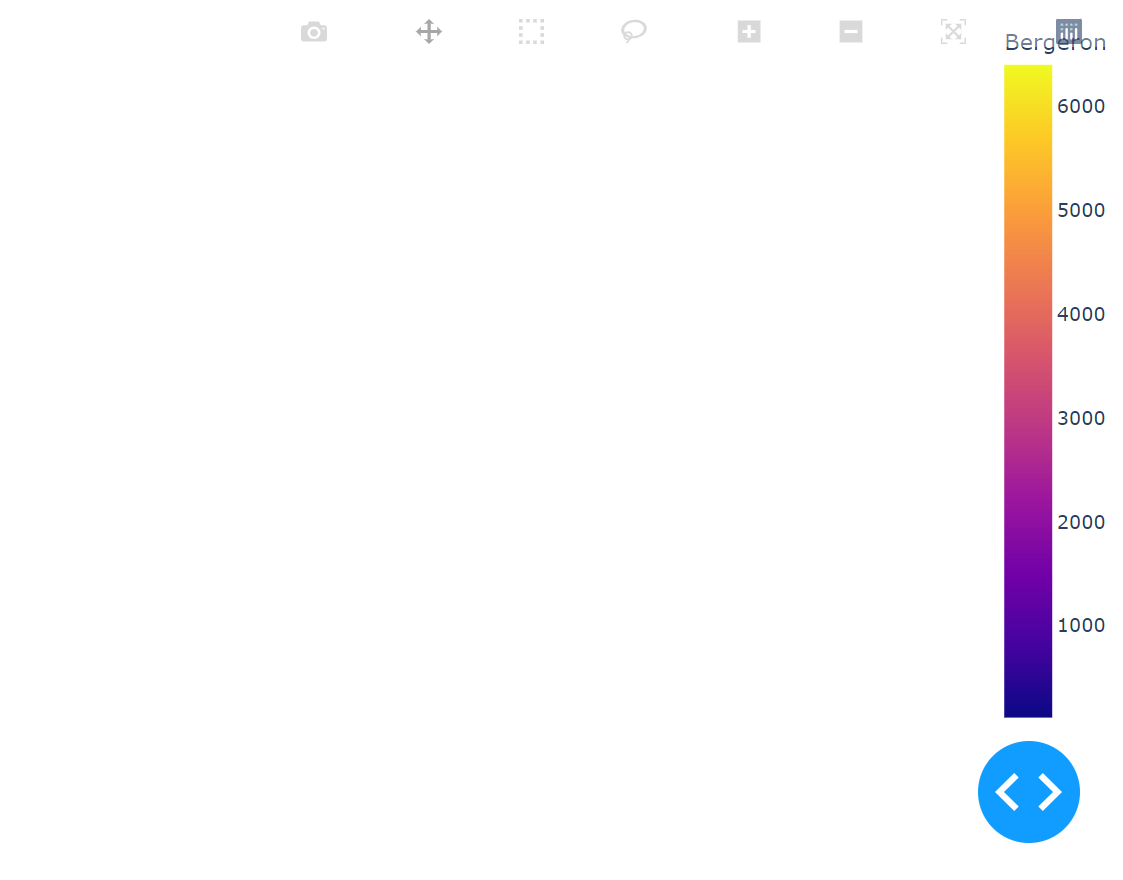
I’m experiencing an issue where the plolty px choropleth maps don’t show up in dash apps. All that is visible is the color bar scale.
I can save the plots to a html file and they appear as expected. E.g.

Here’s a simple code example:
import plotly.express as px
from dash import Dash, dcc, html


#data for choropleth
df = px.data.election()
geojson = px.data.election_geojson()

#create choropleth plot
fig = px.choropleth(df, geojson=geojson, color="Bergeron",
                    locations="district", featureidkey="properties.district",
                    projection="mercator"
                   )
fig.update_geos(fitbounds="locations", visible=False)
fig.update_layout(margin={"r":0,"t":0,"l":0,"b":0})
fig.write_html("choropleth_map.html")

#create dash app
PORT = "9000"
ADDRESS = "0.0.0.0"

app = Dash(__name__, suppress_callback_exceptions=True)

app.layout = html.Div([
    dcc.Graph(
            id="choropleth",
            figure = fig,
        ),
])

if __name__ == "__main__":
    app.run_server(debug=True, port=PORT, host=ADDRESS)
I’m using the latest versions of dash/plotly (dash==2.5.1 and plotly == 5.9.0)
Things I’ve tried:
- Creating the same plot using ploty graph objects.
- Using old versions of dash/ploty (e.g. dash==2.4.0 and plotly==5.8.0)
I’ve found an old forum thread where users have the same issue, in their case it was solved by using older versions of plotly/dash but I’m yet to find any combination that fixes the issue for me: