By Emily Kellison-Linn.
Read this article on the Plotly blog
At Plotly, we’re always excited about collaboration and contributions from the broader open-source community. This fall, an exciting collaboration emerged: The team at Narwhals began the effort to integrate the Narwhals library, a dataframe compatibility layer, into Plotly.py, to provide universal dataframe support in Plotly with full backwards compatibility for Plotly.py developers.
This gives Plotly.py full native support for Pandas, Polars, and PyArrow, and provisional support for cuDF and Modin dataframes. Plotly developers don’t need to change their code at all to take advantage of these performance improvements: All you need to do is update to the latest Plotly.py 6.0 release candidate.
pip install plotly==6.0.0rc0
Likewise, open-source Dash and Dash Enterprise developers can take advantage of these improvements today by upgrading the Plotly.py version in your Dash apps to the latest Plotly.py RC, giving a performance boost to any of your Dash apps that generate figures with large datasets.

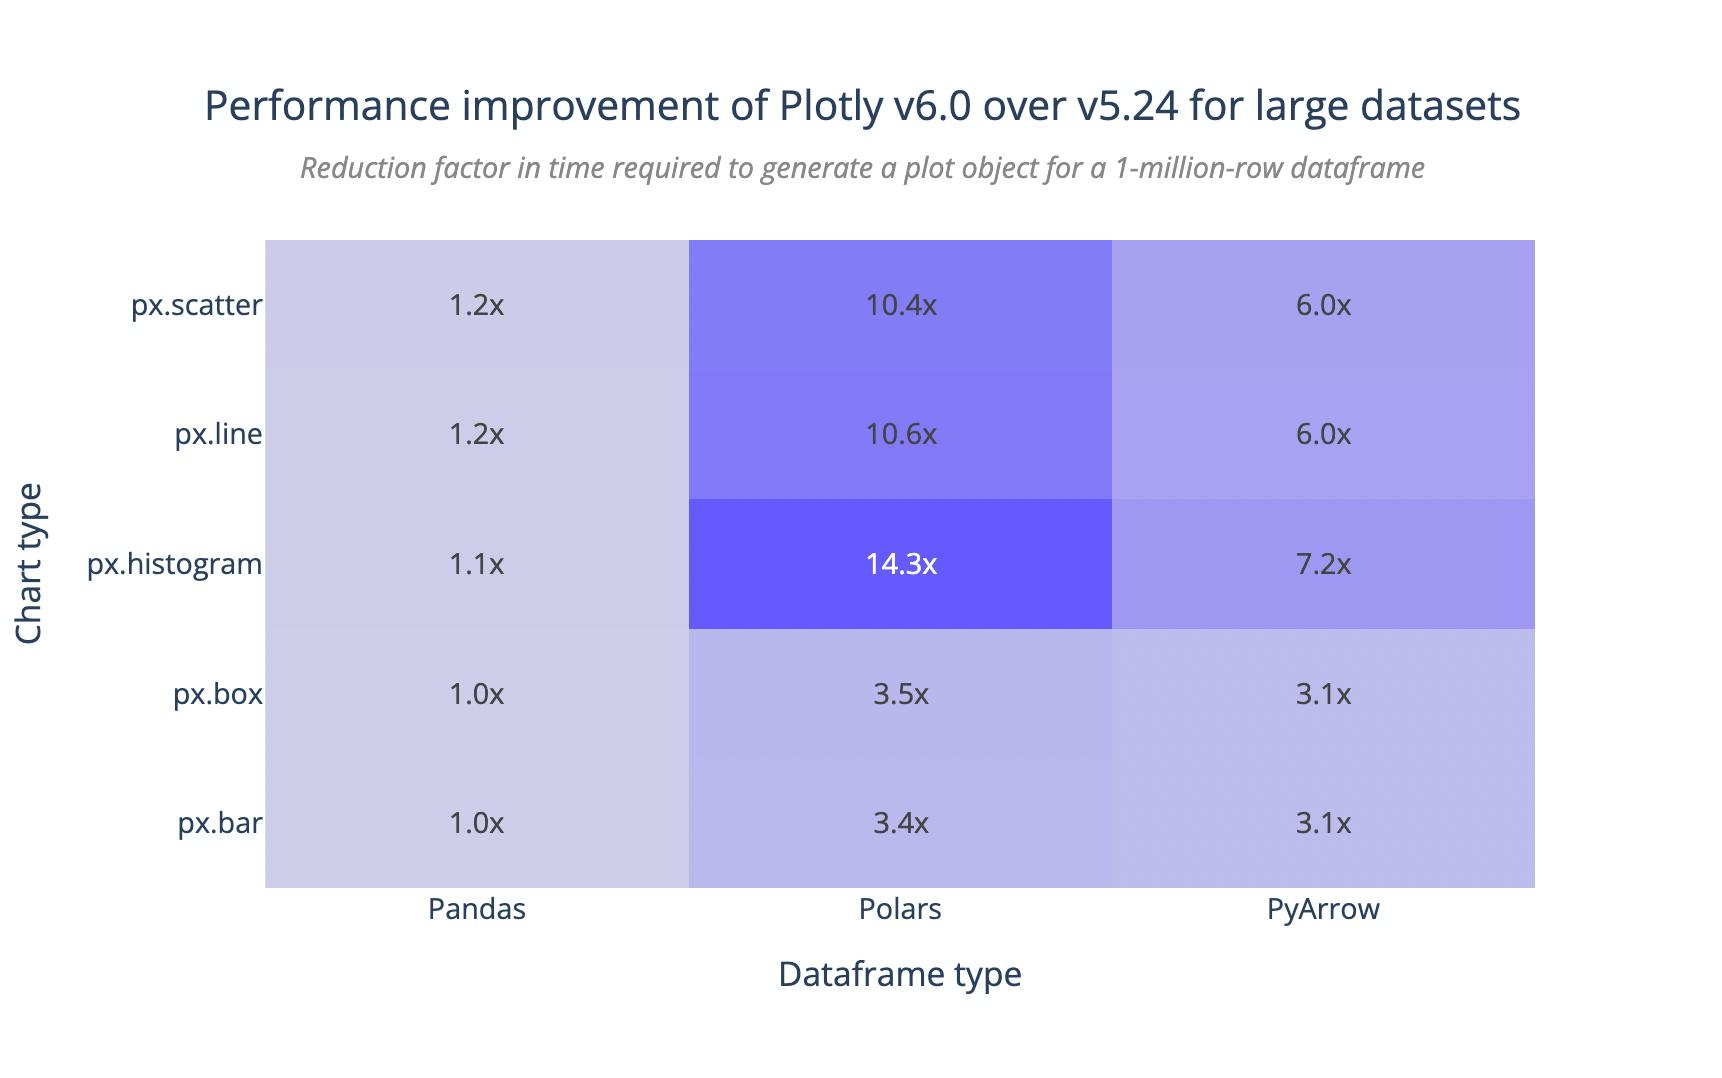
Thanks to general performance improvements to Plotly Express as part of this project, not only is there no net overhead with the addition of Narwhals to Plotly, but Pandas developers should in fact see a slight performance increase. Polars and PyArrow see a massive 3x-14x performance improvement for large datasets compared to previous versions of Plotly.py using the dataframe interchange protocol. Tests run on an Apple M1 processor with 16gb of RAM. (Profiling source code)
The evolution of dataframe support in Plotly.py
In August 2023, Plotly.py introduced support for the dataframe interchange protocol. This change allowed users to pass Polars dataframes, or any other dataframe supporting the interchange standard, directly into Plotly.py. Under the hood, though, we immediately converted those dataframes to Pandas, which can be slow and computationally intensive, especially for large dataframes.
Furthermore, with the dataframe interchange protocol, any operations performed on the data by Plotly Express, including sorts and aggregations, were performed using the Pandas API. This meant developers using Plotly were unable to take advantage of the performance benefits offered by other dataframe libraries once the data was handed off to Plotly. It also meant that developers had to install Pandas to use Plotly Express, even if they weren’t using Pandas dataframes.
With Narwhals, we’re taking a different approach. Rather than converting dataframes from one type to another, Narwhals wraps dataframes in a unified lightweight API layer, while keeping the dataframe itself in its original form. This means we can completely skip an expensive data conversion step. Operations are then executed using the API of the underlying dataframe.
Narwhals supports a wide range of dataframe types; of those, Plotly has been tested with Pandas, Polars, and PyArrow, and offers provisional support for cuDF and Modin as well.
Provisional support for cuDF and Modin means that they have been tested by hand with most Plotly Express chart types, but they are not yet included in our suite of automated test cases. DuckDB, Ibis, and other dataframes supporting the dataframe interchange protocol are supported via conversion to PyArrow, as is PySpark via conversion to Pandas.
The Narwhals team is always evaluating new dataframe types to add native support for — including DuckDB, PySpark, and FireDucks — and as that support is added, Plotly will inherit it as well. To this end, if there’s a dataframe type you’d love to have native support for in Plotly, don’t hesitate to reach out or open a ticket on Github.
What the Plotly x Narwhals integration means for developers
What does this change mean for Plotly.py users? For Plotly Express developers using any supported dataframe type besides Pandas in Plotly charts today, just updating the Plotly.py library in your project to 6.0 will likely bring a significant speed improvement for any chart generation. Developers using Pandas will also see a slight speed improvement, as a result of optimizations in Plotly Express made during this effort, but should expect similar performance after the upgrade with full backwards compatibility.
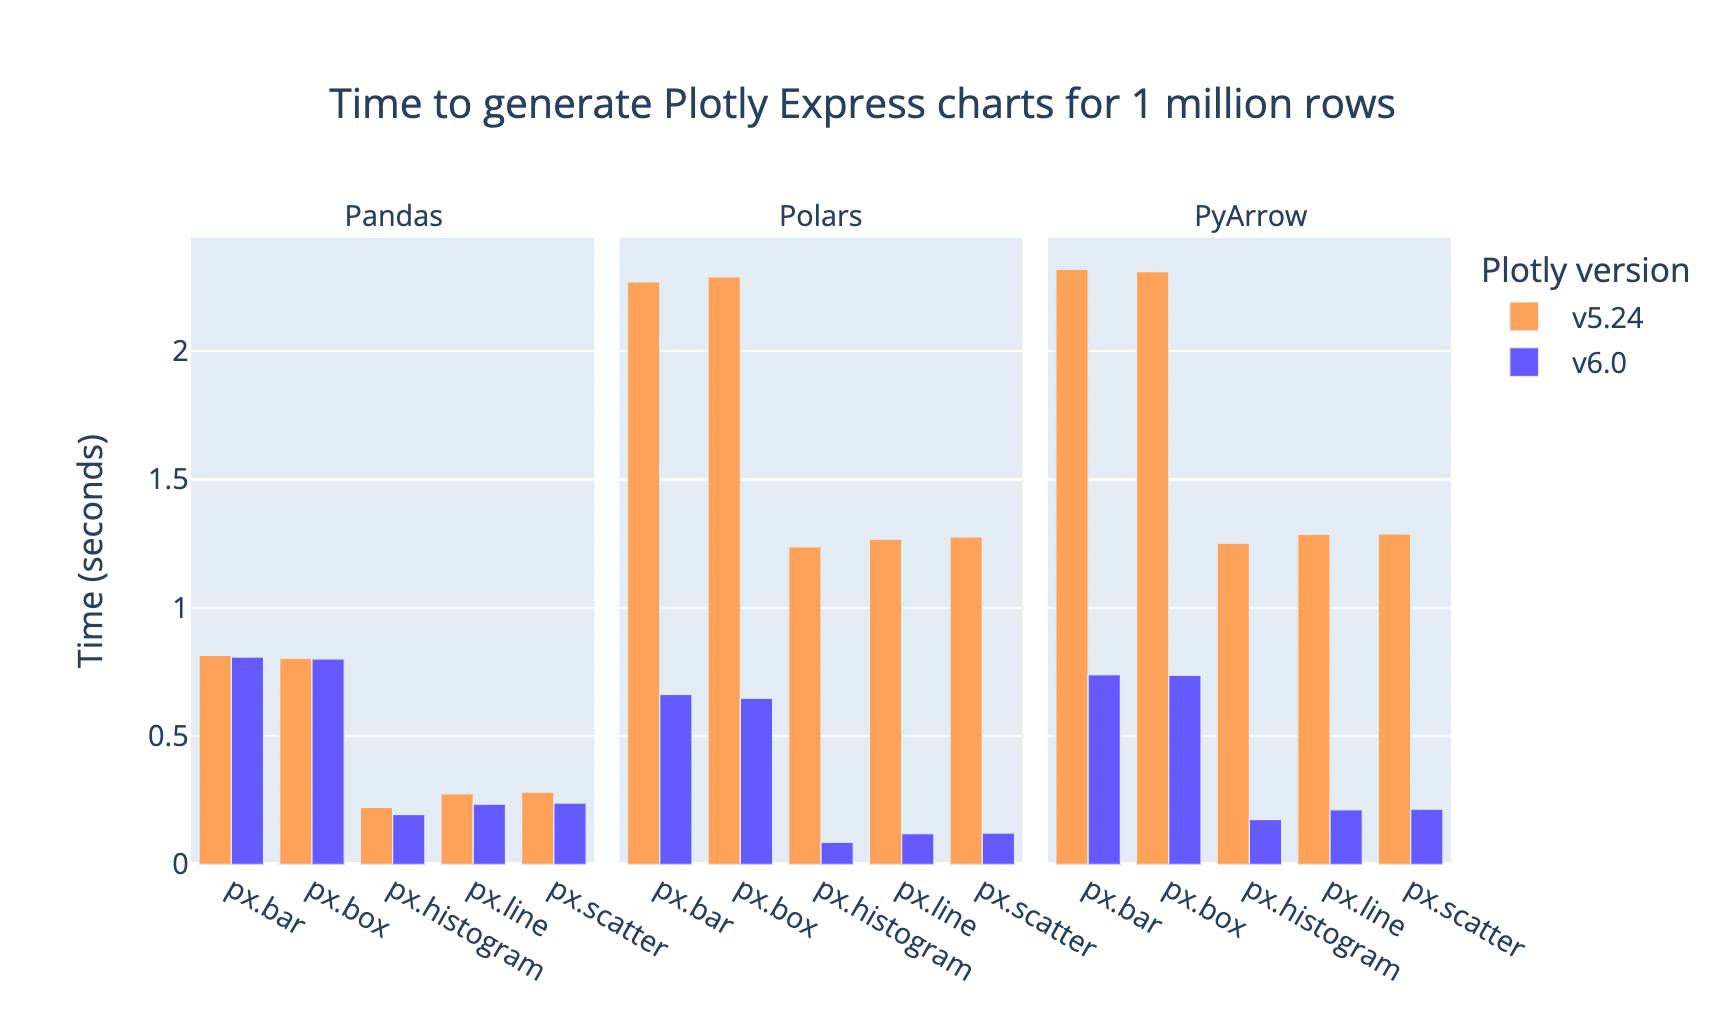
Following this upgrade, Plotly developers currently using Pandas may consider trying out other dataframe libraries for charts using large datasets. In our testing, chart generation performance can increase by a factor of 2-3x for some chart types when switching to another dataframe type, meaning a marked improvement in Dash app and notebook performance for large charts.

For many trace types with large data, using Polars and PyArrow for data management can be even faster than Pandas, as Plotly now uses native APIs to run transformations before rendering the figure. Tests run on an Apple M1 processor (8 cores) with 16gb of RAM. Profiling source code.
In Dash applications, end users will see a benefit from these performance improvements: In many Dash apps, interactions with controls, filters, and dropdowns often regenerate charts from scratch in a callback, and reducing the time to generate those charts will provide a noticeable impact on performance for viewers of the app.
A special thanks to the Narwhals team
We’re really excited about these changes, and thankful for the team over at Narwhals. Marco Gorelli and Francesco Bruzzesi have done an incredible job working on a complex pull request, running performance profiles, adding test cases, and issuing new releases of Narwhals to support dataframe operations used by Plotly, all in the spirit of maintaining backwards compatibility for any developers already using any dataframe type with their Plotly charts.
To learn more about exciting updates to Plotly and Dash, attend our upcoming webinar.