I am plotting different plots assigned in each updatemenus button using plotly. But I am not to change the axis for each plot in different buttons separately. If I use fig.update_yaxes(range=[y_min, y_max]) to change the y-axis limit then it changes the y-axis limit for both plots in two buttons. Please look at this example with its code and output figure.
fig = go.Figure()
fig.add_trace(
    go.Scatter(
            x=df['Date'],
            y=df['AOD'],
            error_y=dict(
                type='data', # value of error bar given in data coordinates
                array=df['AOD.1'],
                visible=True)
        )
)
fig.update_yaxes(range=[0, 1.5])    # y axis limit for first plot

fig.add_trace(
    go.Scatter(
            x=df['Date'],
            y=df['FMF'],
            error_y=dict(
                type='data', # value of error bar given in data coordinates
                array=df2['FMF.1'],
                visible=True)
        )
)
fig.update_yaxes(range=[0, 1])    # y axis limit for second plot
fig.layout.update(
   updatemenus = [go.layout.Updatemenu(
                 type = "buttons", direction = "right", active = 1, x = 0.5, y = 1.2,
buttons = list([dict(label = "AOD", method = "update",
                  args = [{"visible": [True, False]},{"title": "AOD"} ]),
               dict(label = "FMF", method = "update",
                  args = [{"visible": [False, True]},{"title": "FMF"}])]))])
fig.show()
The output of the above code is:

I want the 1st plot for button AOD should have limit [0 1.5]:

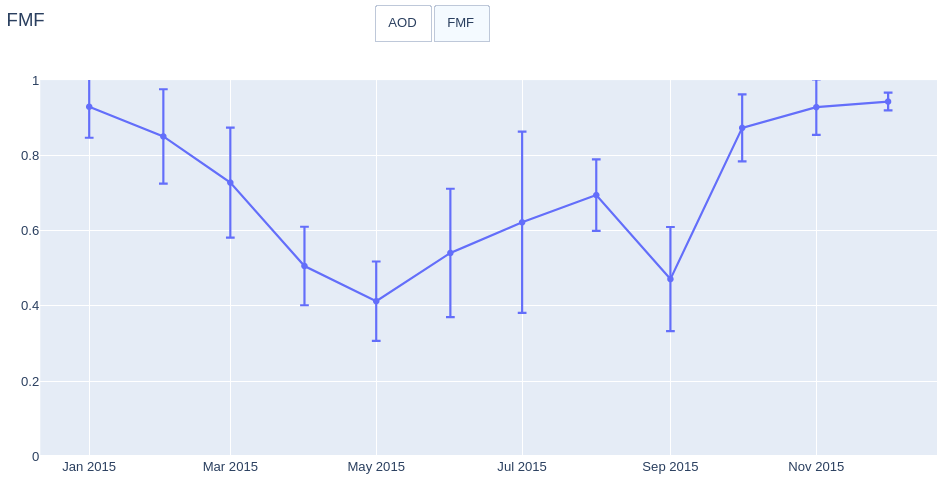
And the 2nd plot for button FMF should have limit [0 1.0]:

Please help me with this problem for getting the desired output with separate limit for each plot in the button.