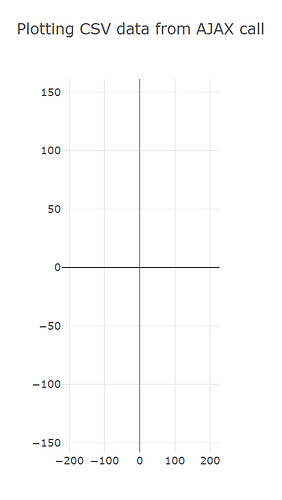
Hi, I’ve been trying to make a scatter plot in HTML using JS and it shows up empty whenever I pass in the arrays for the x and y axis values. However, when hardcoding the data it works just fine. What seems to be the issue here? I’m pretty new to Plotly and JS so this could be a pretty simple question.
For reference, this is what my code looks like:
var fs = require(‘fs’);
var data = fs.readFileSync(‘python/1st.csv’)
.toString()
.split(‘\n’)
.map(e => e.trim())
.map(e => e.split(‘,’).map(e => e.trim()));
var x_axis =
var y_axis =
for (var i = 0; i < data.length; i++){
x_axis.push(data[i][1])
y_axis.push(data[i][2])
}
function Graph1(){
var data = [{
x: x_axis,
y: y_axis,
mode: ‘markers’,
type: ‘scatter’,
marker: { size: 12 }
}];
var layout = {
title:‘Rookies’
};
Plotly.newPlot(‘Graphfstpick’, data, layout);
}

