We are excited to announce the Plotly Autumn App Challenge that will build on Plotly’s transition to MapLibre, bringing faster performance and increased stability to all of our map-type charts.
We challenge the community to build a Dash app around the data on the Michelin Star Restaurant Guide, provided by Jerry Ng on Kaggle.
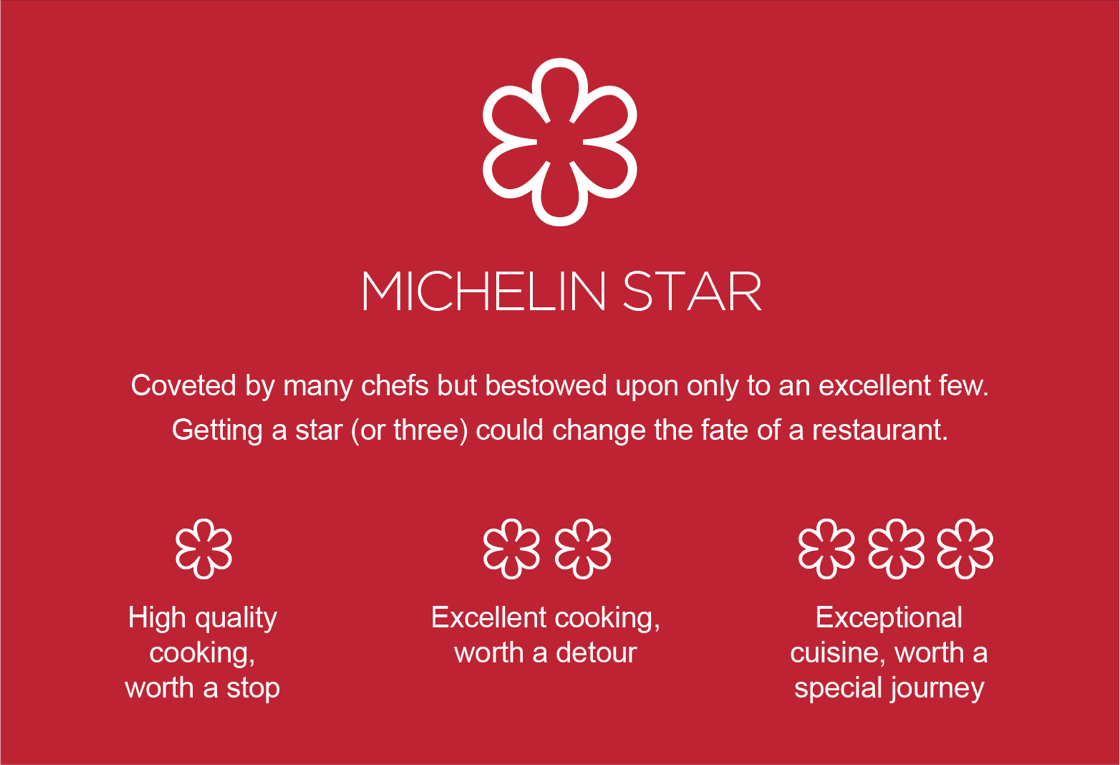
Over time, Michelin stars have earned a reputation for prestige, thanks to their rigorous criteria and the scrutiny of anonymous inspectors. These stars are highly sought after, because earning even a single star has the power to transform a chef’s career; though losing a star can have just as profound an impact.
The winning apps will be judged according to the following categories:
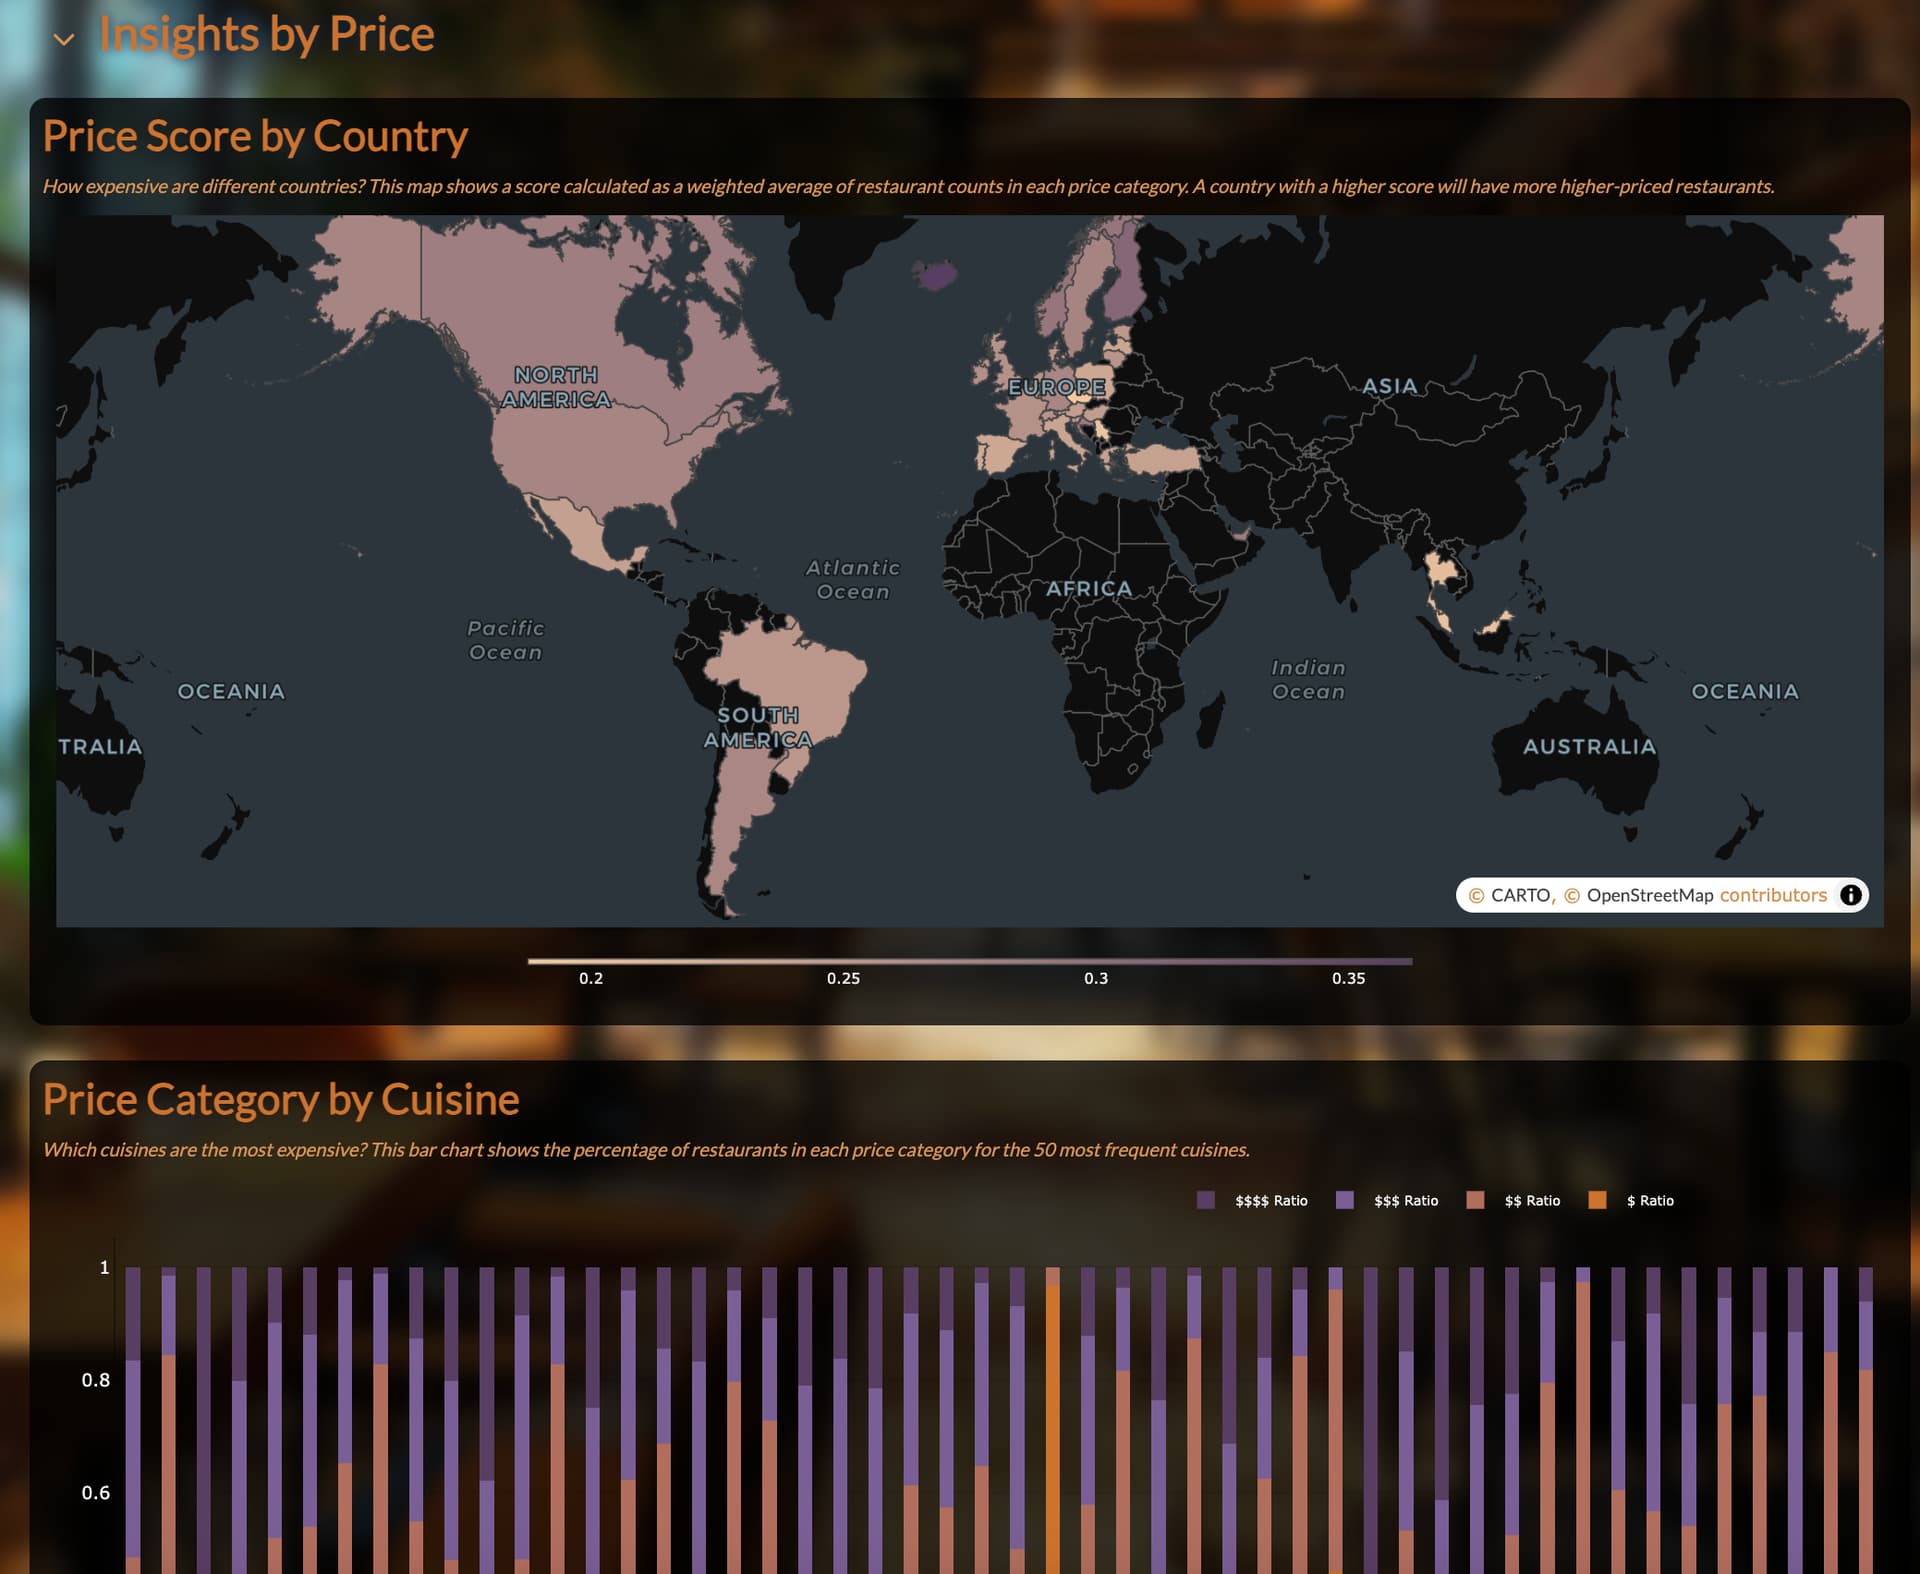
- Data insights revealed from the data set
- App UI/UX Design
- Creative usage of Plotly maps
- Bonus points for integration of LLMs to gain more data insight
Please submit your app as a new post in this thread. Please include a link to the app if possible, code on GitHub, and a short description of the app.
The submission deadline is the end of the day Sunday, November 3, 2024.
The winners will be announced in November and will receive a reward of: $125 for first place, $75 for second, and $50 for third place.
Helpful resources for mapping:
pip install plotly==5.24.1to take advantage of the new MapLibre traces- Migrating from Mapbox traces to MapLibre
- Plotly Maps docs
Sample visualization:
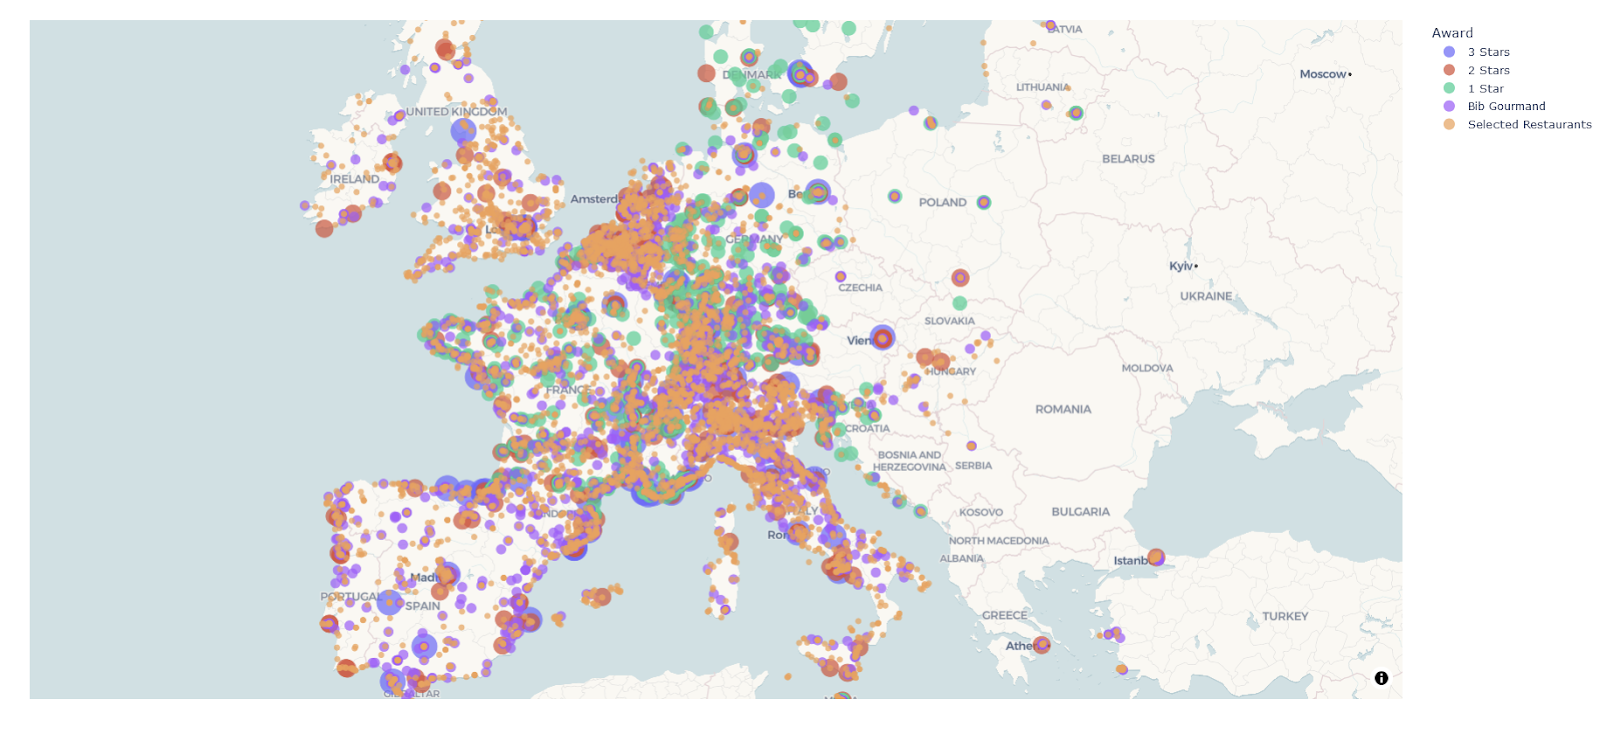
Code for visualization:
import pandas as pd
import plotly.express as px

df = pd.read_csv("https://raw.githubusercontent.com/plotly/datasets/master/michelin_by_Jerry_Ng.csv")

# Define marker sizes based on the award
def size_mapping(award):
    if award == '3 Stars':
        return 30
    elif award == '2 Stars':
        return 15
    elif award == '1 Star':
        return 10
    elif award == 'Bib Gourmand':
        return 5
    else:
        return 2

df['award_size'] = df['Award'].apply(size_mapping)

fig = px.scatter_map(data_frame=df,
                  	 lat="Latitude",
                  	 lon="Longitude",
                  	 color="Award",
                  	 size="award_size",
                  	 hover_data={"award_size":False},
                  	 zoom=4,
                  	 center={"lat":47.6, "lon":2.62})
fig.show()