I am using plotly js scatter plot. My data on x-axis is in the format of time [‘00:01’, ‘00:02’, ‘00:03’, ‘00:04’, ‘00:05’, ‘00:06’, ‘00:07’, ‘00:08’, ‘00:09’, ‘00:10’, ‘00:11’, ‘00:12’, ‘00:13’, ‘00:14’, ‘00:15’, ‘00:16’, ‘00:17’, ‘00:18’, ‘00:19’…‘23:59’]
currently my x-axis looks like below

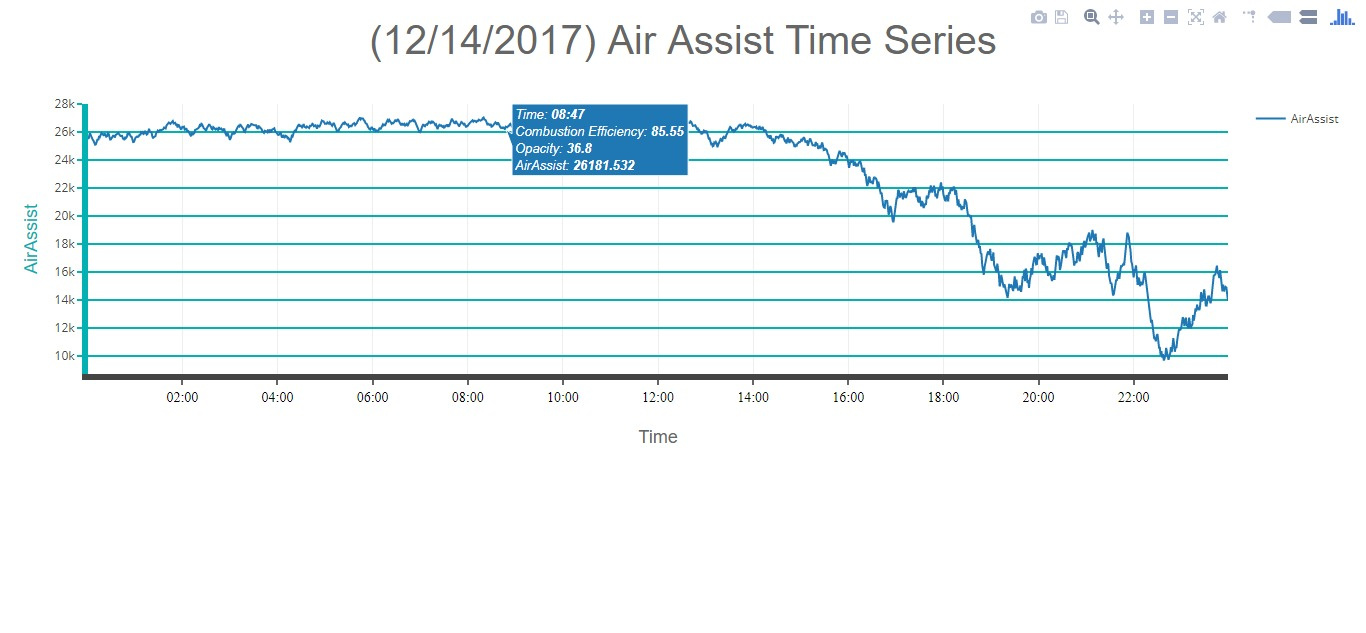
But I want my x-axis to look like below:
I can achieve this result by using tickvals, but if I use that then after zooming it shows only 2 hour intervals only. I want it to dynamically change it to 1 hour or 30 mins or 15 mins interval when zoomed in accordingly.
Code for X axis:
xaxis: {
title: ‘Time’,
titlefont: {
family: ‘Arial, sans-serif’,
size: 18,
color: ‘#666666’
},
ticks: ‘outside’,
tickcolor: ‘#666666’,
zeroline: true,
zerolinecolor: ‘#666666’,
zerolinewidth: 4,
linewidth: 6,
tickfont: {
family: ‘Old Standard TT, serif’,
size: 14,
color: ‘black’
},
},
How can I do that?