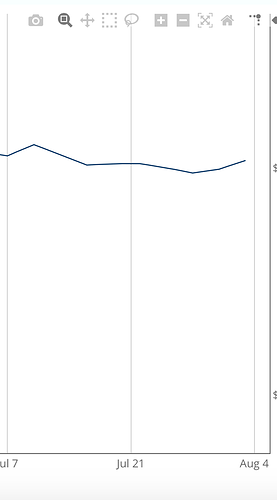
Does anyone have any ideas what is causing this gap between the end to the trace and the y2 axis?
I’m not aware that I’ve done anything intentionally to create it, and I can’t “spot the difference” between this chart and others.
The end of the line does represent the last x/y combination in my data.
layout element of my figure looks like this
'layout' : go.Layout(
        xaxis= dict(
            color=colors['labels'],
            showspikes=True,
            hoverformat='%d-%b-%y',
            gridcolor=colors['gridlines'],
            showline=True,
            spikemode='toaxis+across',
            spikedash='solid',
            spikethickness=1,
            spikecolor=colors['spike'],
        ),
        yaxis=dict(
            title='MA',
            color=colors['labels'],
            side='left',
            hoverformat='%',
            range=[0,1],
            showspikes=True,
            spikemode='toaxis',
            spikedash='solid',
            spikethickness=1,
            spikecolor=colors['spike'],
            showgrid=False,

            tickformat='%',
        ),
        yaxis2=dict(
            title='Price',
            color=colors['labels'],
            side='right',
            type='log',
            dtick=1,
            hoverformat='$,.2f',
            overlaying='y',
            showline=True,
            zeroline=True,
            showspikes=True,
            spikemode='toaxis',
            spikedash='solid',
            spikethickness=1,
            spikecolor=colors['spike'],
            showgrid=False,
            ticktext=tick_text,
            tickvals=tick_values,

        ),
        margin=go.layout.Margin(
            t=10,
        ),
        uirevision='False',
        hovermode='closest',
        legend=dict(
            orientation='h',
            font= dict(
                color=colors['labels'],
            ),
            x=0.1,
        ),
    ),
