Hello,
Someone can tell me why my graph goes like this ? I did not update my code which was working…
I’m so confuse because I dont know where to fix this issue 
Can someone help me ?
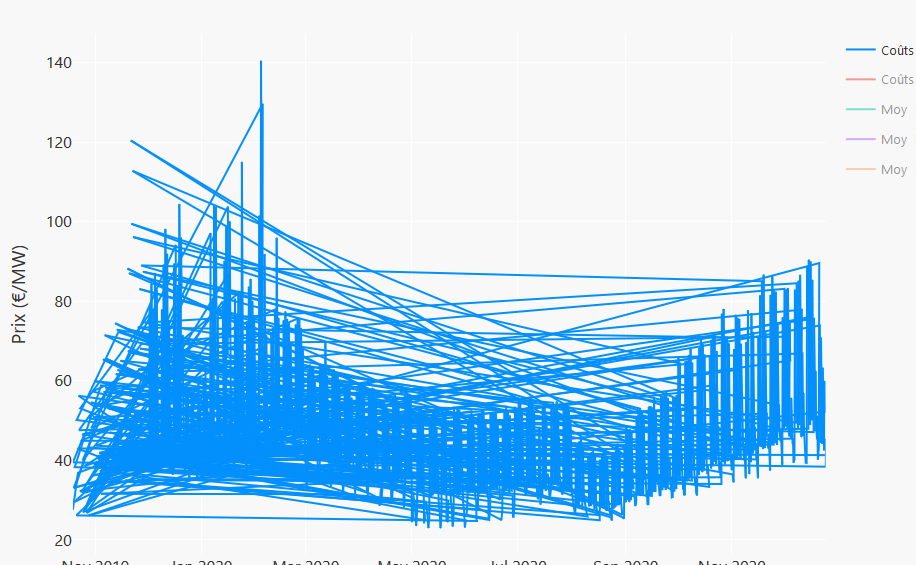
Hi @Josiias this looks like a scatter plot with mode='lines' where the x data points are not sorted, hence all the zigzag lines.
If you wish to have only points and not lines use px,scatter (see this example) or mode='markers' in go.Scatter as described here.
If you want to want to display lines then you need to sort your x data (using for example np.sort).
If none of this works then you need to tell us more about your code and data :-).
Thank you it was due to an unsorted xaxis data .
You are the best 