Hi @gekko102,
I think you’ll need to convert the nan values to some other value and then use a custom colorscale.
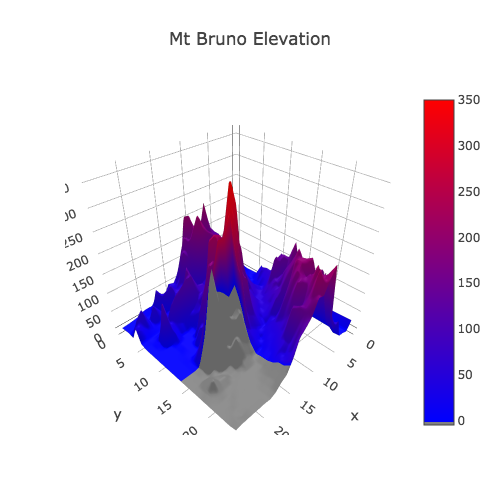
Here’s an example
import plotly.plotly as py
import plotly.graph_objs as go
import numpy as np
import copy

import pandas as pd

# Read data from a csv
z_data = pd.read_csv('https://raw.githubusercontent.com/plotly/datasets/master/api_docs/mt_bruno_elevation.csv')
z=z_data.values.copy()

# Compute surface color with nan's
surfacecolor = z.copy()
surfacecolor[-10:, -10:] = np.nan

# Replace nans with -100
surfacecolor[np.isnan(surfacecolor)] = -100

# Build surface trace
data = [
    go.Surface(
        z=z,
        surfacecolor=surfacecolor,
        cmin = -5,
        cmax = 350,
        colorscale=[[0, 'gray'],
                    [0.01, 'gray'],
                    [0.01, 'blue'],
                    [1, 'red']]
    )
]

# Build layout
layout = go.Layout(
    title='Mt Bruno Elevation',
    autosize=False,
    width=500,
    height=500,
    margin=dict(
        l=65,
        r=50,
        b=65,
        t=90
    )
)
fig = go.FigureWidget(data=data, layout=layout)
fig
Hope that helps get you started,
-Jon