Using the surface object, how can I make NaN’s grey? (a color not in the colorscale that I am using (RdBu))
Hi @gekko102,
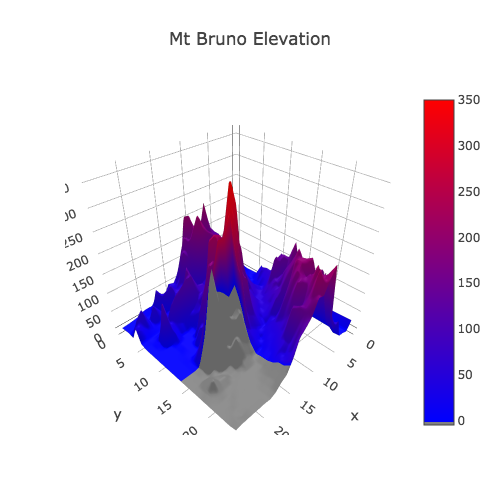
I think you’ll need to convert the nan values to some other value and then use a custom colorscale.
Here’s an example
import plotly.plotly as py
import plotly.graph_objs as go
import numpy as np
import copy

import pandas as pd

# Read data from a csv
z_data = pd.read_csv('https://raw.githubusercontent.com/plotly/datasets/master/api_docs/mt_bruno_elevation.csv')
z=z_data.values.copy()

# Compute surface color with nan's
surfacecolor = z.copy()
surfacecolor[-10:, -10:] = np.nan

# Replace nans with -100
surfacecolor[np.isnan(surfacecolor)] = -100

# Build surface trace
data = [
    go.Surface(
        z=z,
        surfacecolor=surfacecolor,
        cmin = -5,
        cmax = 350,
        colorscale=[[0, 'gray'],
                    [0.01, 'gray'],
                    [0.01, 'blue'],
                    [1, 'red']]
    )
]

# Build layout
layout = go.Layout(
    title='Mt Bruno Elevation',
    autosize=False,
    width=500,
    height=500,
    margin=dict(
        l=65,
        r=50,
        b=65,
        t=90
    )
)
fig = go.FigureWidget(data=data, layout=layout)
fig
Hope that helps get you started,
-Jon
Hey Jon,
Thanks for the advice.
Quick question though: wouldn’t this solution ever so slightly shift the linear interpolation range of the colorscale so that it happens from 0.01 - 1? Even if it does, for my purposes this is fine, I’m just wondering if that is what’s happening.
Hi @gekko102,
Yes, this would shift the interpolation range a small amount. With a bit more care, it would be possible to set cmin to a value that would cause the colorscale’s zero to line up exactly with the bottom of the colored region of the colorbar, in which case the coloring would be identical to the case without nan’s with cmin set to 0.
For the example above
cmin = 350 - 350/0.99
     = -3.5353
Hope that makes sense,
-Jon
I understand, you’re basically making ‘deadspace’ for the 0.01 you allocated to the gray nans.
Thanks for your helpful responses Jon.