To my knowledge, there’s two main ways to create subplots:
make_subplots(), then add trace data - example here
create list of data, inject into go.Figure() - example here (see hover on subplots)
I’m not sure which one’s the preferred one, but update_yaxes affects them differently.
If we use method 1, the update_yaxes affects all yaxes as intended
Can someone help me investigate why the update_yaxes doesn’t play well with the second way of creating subplots?
example code for method 1 - using subplots
import plotly.graph_objects as go
from plotly import data
from plotly.subplots import make_subplots

df = data.stocks()


fig = make_subplots(rows=3, cols=1, shared_xaxes=True, vertical_spacing=0.03)
layout = dict(
    hoversubplots="axis",
    title="Stock Price Changes",
    hovermode="x",
    grid=dict(rows=3, columns=1),
)

fig.add_trace(go.Scatter(x=df["date"], y=df["AAPL"], name="Apple"), row=1, col=1)
fig.add_trace(go.Scatter(x=df["date"], y=df["GOOG"], name="Google"), row=2, col=1)
fig.add_trace(go.Scatter(x=df["date"], y=df["AMZN"], name="Amazon"), row=3, col=1)
fig.update_layout(layout)
fig.update_yaxes(dict(rangemode='tozero'))

fig.show()
example code for method 2 - specifying axis directly
import plotly.graph_objects as go
import pandas as pd
from plotly import data

df = data.stocks()

layout = dict(
    hoversubplots="axis",
    title=dict(text="Stock Price Changes"),
    hovermode="x",
    grid=dict(rows=3, columns=1),
)

data = [
    go.Scatter(x=df["date"], y=df["AAPL"], xaxis="x", yaxis="y", name="Apple"),
    go.Scatter(x=df["date"], y=df["GOOG"], xaxis="x", yaxis="y2", name="Google"),
    go.Scatter(x=df["date"], y=df["AMZN"], xaxis="x", yaxis="y3", name="Amazon"),
]

fig = go.Figure(data=data, layout=layout)
fig.update_yaxes(dict(rangemode='tozero'))
fig.show()
The property I’m playing with is the yaxes’ rangemode, where I’d like all subplots to have a lower y value to be 0, the first method modified all three subplots, the second one modified the first subplot only
In this case, there are three Y-axes, each of which must be specified.
fig.update_layout(yaxis=dict(rangemode="tozero"))
fig.update_layout(yaxis2=dict(rangemode="tozero"))
fig.update_layout(yaxis3=dict(rangemode="tozero"))
I do not understand why we have to specify this manually, feels wrong.
fig.update_yaxes()
fig.for_each_yaxis(lambda x: x.update(rangemode="tozero")
should work IMHO. It seems that subplots uses the yaxes differently.
@RSDummy if you want to dig deeper into this, you migt compare the figure structure oft the two figures fig.to_dict()
The current confusion at hand is the inconsistent behavior. update_yaxes’ documentation states that the supposed behavior is to modify all y-axes at once, link
“By default, these methods apply to all of the x axes or y axes in the figure. The row and col arguments can be used to control which axes are targeted by the update.”
method 1’s fig.layout
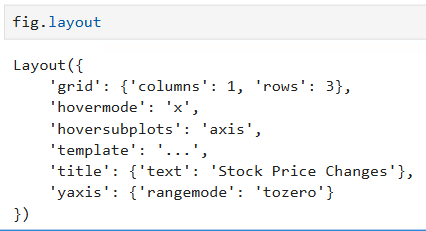
method 2’s fig.layout
The function is able to recognise that it needs to modify yaxis, yaxis2, etc, but only when creating subplots via method 1.
@RSDummy , would you mind creating an issue on gitHub?
I’ve opened an issue on github, I hope the format is legible!
opened 11:38AM - 02 Jun 25 UTC
--copied from the plotly forum here https://community.plotly.com/t/update-yaxes-… behavior-when-using-make-subplots-vs-specifying-axes-directly/92496--
To my knowledge, there’s two main ways to create subplots:
make_subplots(), then add trace data - example [here](https://community.plotly.com/t/hoversubplots-axis-not-working-with-make-subplots/84239)
create list of data, inject into go.Figure() - example [here](https://plotly.com/python/hover-text-and-formatting/) (see hover on subplots)
I’m not sure which one’s the preferred one, but update_yaxes affects them differently.
If we use method 1, the update_yaxes affects all yaxes as intended
If we use method 2, the update_yaxes only affects the first subplot
Is there a reason why update_yaxes doesn’t play well with the second way of creating subplots?