Subplots with two y axes, again

I can’t find out how to assign a secondary – right – y-axis to a subplot. This post on the Plotly forum - Subplots with two y axes - helped me on the way, but …

although the second y-axis (y3 AKA yaxis3) of the top subplot appears on the right (i.e. the fig[‘layout’][‘yaxis3’].update works),

the 2 traces (1 line, 1 marker) which should be linked to right y-axis y3, remain linked to the left y-axis y1.

Summary: both the top and the bottom subplot appear as expected, incl; the secondary y-axis of the top subplot. Only the 2 traces of the top subplot which should be linked to the secondary y-axis are still linked to the primary y-axis. How exactly should I assign ‘y3’ to yaxis3?

for iii in range(0,len(pc)):

trace[ii+iii+1] = go.Scatter(
x = col0,
y = col1,
name = hovertext[iii],
mode = ‘markers’,
xaxis = ‘x1’,
yaxis = ‘y1’ if iii!=9 else ‘y3’, # only the 10th trace should use the right y-axis y3 i/o y1
line = dict(width=0, color=colors[iii]),
marker = dict(

)
)
)

fig = tools.make_subplots(rows=2, cols=1, shared_xaxes=False, vertical_spacing = 0.5)

for n in range(0,iii+ii+2): # top subplot with 2 y axis’ - 10 th trace uses y3, the rest y1
** fig.append_trace(trace[n], 1, 1)**

fig.append_trace(trace[iii+ii+2], 2, 1) # simple x2 y2 subplot on the botttom
fig.append_trace(trace[iii+ii+3], 2, 1)

fig[‘layout’][‘xaxis1’].update(
title=’% Load’,
domain=[0, 1],
range=[0, 110],

)
fig[‘layout’][‘yaxis1’].update(
title=‘°C bar mm g/kWh engine rpm’,
domain=[0.15, 1],
range=[-1, 600],

)
fig[‘layout’][‘yaxis3’].update(
** anchor=‘x1’, **
** overlaying=‘y1’, **
** side=‘right’,**
title=‘T/C rpm’,
domain=[0.15, 1],
range=[14000, 18500],

)

fig['layout']['xaxis2'].update(                                                         # bottom subplot
        title='UTC timestamp',
        domain=[0, 1],
        ticklen=0.25, 
        )
fig['layout']['yaxis2'].update(
        title='% load',
        domain=[0, 0.1],
        range=[-10, 110], 
        ...
        )       

fig['layout'].update(
    ...
    )

plotly.offline.plot(fig, filename=...
1 Like

@Cyberier I posted here: https://plot.ly/~empet/14349 a Jupyter notebook to see how you should define the traces and the layout for a plot with two y-axes.

Thanks, empet, but I don’t have any problem with -secondary y-axes in simple single plots. My problem is that in multiple subplots, although I manage to get the right y-axis drawn using the update function as you suggested in Subplots with two y axes, the trace itself is not linked to that right y-axis. Here’s a simple example with the same problem:

from plotly import tools
import plotly
import plotly.graph_objs as go

trace1 = go.Scatter(x=[1, 2], y=[1.1, 2.1], name=‘1’)
trace2 = go.Scatter(x=[1, 2], y=[1.2, 2.2], name=‘2’,yaxis=‘y3’)
trace3 = go.Scatter(x=[1, 2], y=[1.3, 2.3], name=‘3’)
trace4 = go.Scatter(x=[1, 2], y=[1.4, 2.4], name=‘4’)
trace5 = go.Scatter(x=[1, 2], y=[1.5, 2.5], name=‘5’)
trace6 = go.Scatter(x=[1, 2], y=[1.6, 2.6], name=‘6’)

fig = tools.make_subplots(rows=2, cols=1, shared_xaxes=False, vertical_spacing = 0.5)

fig.append_trace(trace1, 1, 1)
fig.append_trace(trace2, 1, 1)
fig.append_trace(trace3, 2, 1)
fig.append_trace(trace4, 2, 1)
fig.append_trace(trace5, 2, 1)
fig.append_trace(trace6, 2, 1)

fig[‘layout’][‘xaxis1’].update(
domain=[0, 1],
range=[0, 3]
)
fig[‘layout’][‘yaxis1’].update(
title=‘yaxis 1 title’,
domain=[0.15, 1],
range=[-0.1, 3],
zeroline=True,
showline=True,
showgrid=True
)
fig[‘layout’][‘yaxis3’].update(
overlaying=‘y1’,
side=‘right’,
anchor=‘x1’,
domain=[0.15, 1],
range=[-0.1, 3],
zeroline=False,
showline=True,
showgrid=False,
title=‘yaxis 3 title’
)
fig[‘layout’][‘xaxis2’].update(
domain=[0, 1],
range=[0, 3]
)
fig[‘layout’][‘yaxis2’].update(
title=‘yaxis 2 title’,
domain=[0, 0.1],
range=[-0.1, 3]
)
fig[‘layout’].update(
title=‘Customizing Subplot Axes’,
showlegend=False
)

plotly.offline.plot(fig, filename=‘multiple-y-subplots2.html’)

@Cyberier I described in this notebook https://plot.ly/~empet/14352 how to update each dict fig['data'][k], asociated to all the traces in subplots, and the dict fig['layout'], defined initially by calling tools.make_subplots().

1 Like

Thank you very much, empet! Inserting the missing fig[‘data’][1].update(yaxis=‘y3’) line indeed solved it.


fig = tools.make_subplots(rows=2, cols=1, shared_xaxes=False, vertical_spacing = 0.5)

fig.append_trace(trace1, 1, 1)
fig.append_trace(trace2, 1, 1)
fig.append_trace(trace3, 2, 1)
fig.append_trace(trace4, 2, 1)
fig.append_trace(trace5, 2, 1)
fig.append_trace(trace6, 2, 1)

fig[‘data’][1].update(yaxis=‘y3’)

fig[‘layout’][‘xaxis1’].update(
domain=[0, 1],
range=[0, 3]
)

Thanks for the example! I find this to be a very confusing, tedious solution - perhaps there’s space for a more elegant approach to second subplot axes in the future?

@rosswait You are right. The updates are cumbersome. The notebook you read was created long time ago.
Here is a new one adapted to Plotly 3.+ https://plot.ly/~empet/14983.
It would be nice if Plotly defined an option for two yaxes for each cell in a subplot.

1 Like

Hi everybody,

I have the same problem but on R instead of Python.
Do you have any idea ?

Thank you in advance,

Baptiste

The notebook at this link https://plot.ly/~empet/14352 is obsolete.
A new version compatible with Plotly 4.0.0 is available here: https://plot.ly/~empet/14983.

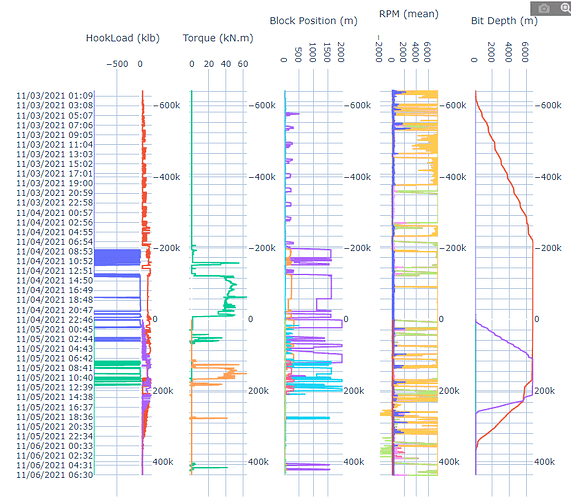
Hi @empet , I am new to plotly and I know this is an old post but I am wondering if I can use plotly to create a subplot with 1 row and multiple columns where all my x_axis in multiple columns refer to the same two y_axis (y_axis1 and y_axis 2). What I have to done is I created a primary y_axis and then shared it for all x_axis, then I created a secondary y_axis for each x_axis. So my secondary y_axis is not shared for all of the columns and I am not sure how I can do it. Ideally, I would like to be able to zoom on any one column and have all of the x axis to zoom on both y_axis at the same time. Hope this makes sense. Attaching the pict below to give you better understanding. As you can see, the primary y axis is shared for all of the x axis in the subplots, and I would like to do the same for secondary_yaxis. Thanks, appreciate you help on this.

1 Like