Hi @stnyu ,
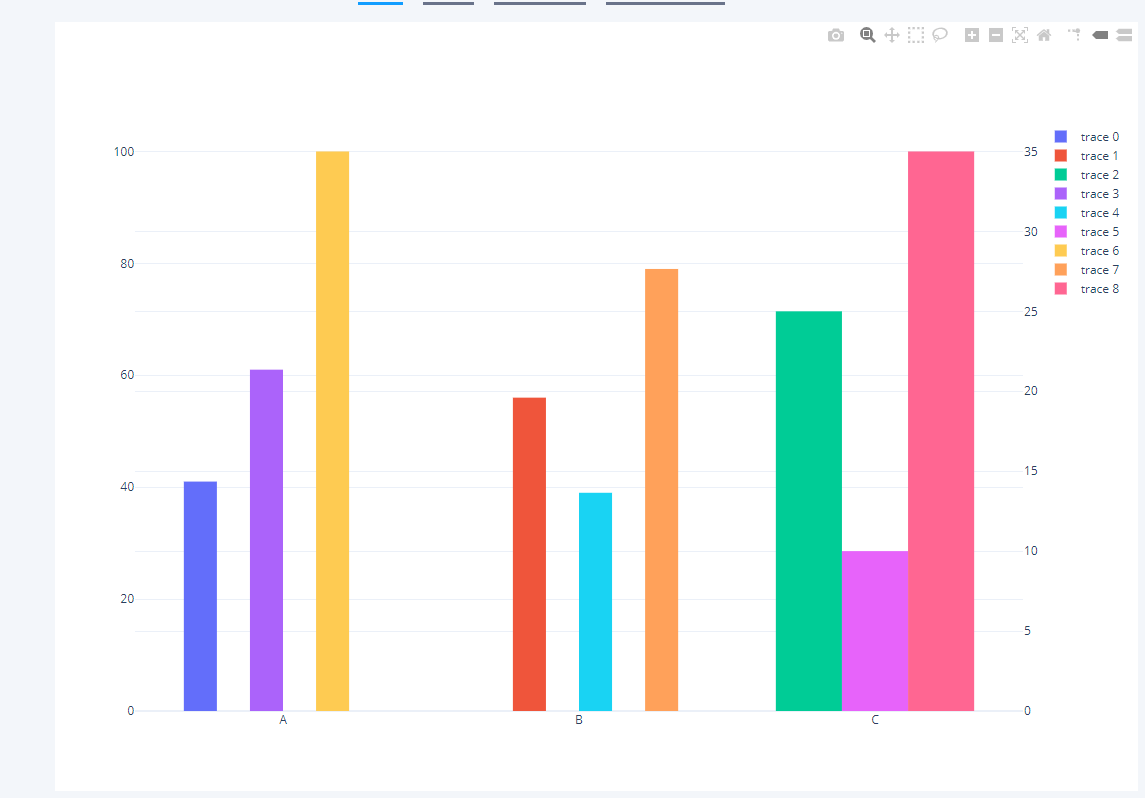
Try to set all bar of all traces with fixed width value.
For this example I set width: 0.08 for every trace.
trace1 = {
  meta: {columnNames: {
      x: 'A',
      y: 'B'
    }},
  mode: 'markers',
  type: 'bar',
  xsrc: 'lainey.w:1:5bd701',
  x: ['A', 'B', 'C'],
  ysrc: 'lainey.w:1:586438',
  y: ['41'],
  orientation: 'v',width: 0.08
};
trace2 = {
  meta: {columnNames: {
      x: 'A',
      y: 'C'
    }},
  type: 'bar',
  xsrc: 'lainey.w:1:5bd701',
  x: ['A', 'B', 'C'],
  ysrc: 'lainey.w:1:dda71f',
  y: [null, '56'],
  orientation: 'v',width: 0.08
};
trace3 = {
  meta: {columnNames: {
      x: 'A',
      y: 'D'
    }},
  type: 'bar',
  xsrc: 'lainey.w:1:5bd701',
  x: ['A', 'B', 'C'],
  ysrc: 'lainey.w:1:c66a1d',
  y: [null, null, '25'],
  yaxis: 'y2',
  orientation: 'v',width: 0.08
};
trace4 = {
  meta: {columnNames: {
      x: 'A',
      y: 'E'
    }},
  type: 'bar',
  xsrc: 'lainey.w:1:5bd701',
  x: ['A', 'B', 'C'],
  ysrc: 'lainey.w:1:122e9a',
  y: ['61'],
  orientation: 'v',width: 0.08
};
trace5 = {
  meta: {columnNames: {
      x: 'A',
      y: 'F'
    }},
  type: 'bar',
  xsrc: 'lainey.w:1:5bd701',
  x: ['A', 'B', 'C'],
  ysrc: 'lainey.w:1:a3782c',
  y: [null, '39'],
  orientation: 'v',width: 0.08
};
trace6 = {
  meta: {columnNames: {
      x: 'A',
      y: 'G'
    }},
  type: 'bar',
  xsrc: 'lainey.w:1:5bd701',
  x: ['A', 'B', 'C'],
  ysrc: 'lainey.w:1:1ed5e0',
  y: [null, null, '10'],
  yaxis: 'y2',
  orientation: 'v',width: 0.08
};
trace7 = {
  meta: {columnNames: {
      x: 'A',
      y: 'H'
    }},
  type: 'bar',
  xsrc: 'lainey.w:1:5bd701',
  x: ['A', 'B', 'C'],
  ysrc: 'lainey.w:1:c2799b',
  y: ['100'],
  orientation: 'v',width: 0.08
};
trace8 = {
  meta: {columnNames: {
      x: 'A',
      y: 'I'
    }},
  type: 'bar',
  xsrc: 'lainey.w:1:5bd701',
  x: ['A', 'B', 'C'],
  ysrc: 'lainey.w:1:cdc02c',
  y: [null, '79'],
  orientation: 'v',width: 0.08
};
trace9 = {
  meta: {columnNames: {
      x: 'A',
      y: 'J'
    }},
  type: 'bar',
  xsrc: 'lainey.w:1:5bd701',
  x: ['A', 'B', 'C'],
  ysrc: 'lainey.w:1:1c4327',
  y: [null, null, '35'],
  yaxis: 'y2',
  orientation: 'v',width: 0.08
};
data = [trace1, trace2, trace3, trace4, trace5, trace6, trace7, trace8, trace9];
layout = {
  xaxis: {
    type: 'category',
    range: [-0.5, 2.5],
    autorange: true
  },
  yaxis: {
    type: 'linear',
    range: [0, 105.26315789473685],
    autorange: true
  },
  bargap: 0.75,
  yaxis2: {
    side: 'right',
    type: 'linear',
    range: [0, 36.8421052631579],
    autorange: true,
    overlaying: 'y'
  },
  autosize: true,
  template: {
    data: {
      bar: [
        {
          type: 'bar',
          marker: {colorbar: {
              ticks: '',
              outlinewidth: 0
            }}
        }
      ],
      table: [
        {
          type: 'table',
          cells: {
            fill: {color: '#EBF0F8'},
            line: {color: 'white'}
          },
          header: {
            fill: {color: '#C8D4E3'},
            line: {color: 'white'}
          }
        }
      ],
      carpet: [
        {
          type: 'carpet',
          aaxis: {
            gridcolor: '#C8D4E3',
            linecolor: '#C8D4E3',
            endlinecolor: '#2a3f5f',
            minorgridcolor: '#C8D4E3',
            startlinecolor: '#2a3f5f'
          },
          baxis: {
            gridcolor: '#C8D4E3',
            linecolor: '#C8D4E3',
            endlinecolor: '#2a3f5f',
            minorgridcolor: '#C8D4E3',
            startlinecolor: '#2a3f5f'
          }
        }
      ],
      mesh3d: [
        {
          type: 'mesh3d',
          colorbar: {
            ticks: '',
            outlinewidth: 0
          }
        }
      ],
      contour: [
        {
          type: 'contour',
          colorbar: {
            ticks: '',
            outlinewidth: 0
          },
          autocolorscale: true
        }
      ],
      heatmap: [
        {
          type: 'heatmap',
          colorbar: {
            ticks: '',
            outlinewidth: 0
          },
          autocolorscale: true
        }
      ],
      scatter: [
        {
          type: 'scatter',
          marker: {colorbar: {
              ticks: '',
              outlinewidth: 0
            }}
        }
      ],
      surface: [
        {
          type: 'surface',
          colorbar: {
            ticks: '',
            outlinewidth: 0
          }
        }
      ],
      heatmapgl: [
        {
          type: 'heatmapgl',
          colorbar: {
            ticks: '',
            outlinewidth: 0
          }
        }
      ],
      histogram: [
        {
          type: 'histogram',
          marker: {colorbar: {
              ticks: '',
              outlinewidth: 0
            }}
        }
      ],
      parcoords: [
        {
          line: {colorbar: {
              ticks: '',
              outlinewidth: 0
            }},
          type: 'parcoords'
        }
      ],
      scatter3d: [
        {
          type: 'scatter3d',
          marker: {colorbar: {
              ticks: '',
              outlinewidth: 0
            }}
        }
      ],
      scattergl: [
        {
          type: 'scattergl',
          marker: {colorbar: {
              ticks: '',
              outlinewidth: 0
            }}
        }
      ],
      choropleth: [
        {
          type: 'choropleth',
          colorbar: {
            ticks: '',
            outlinewidth: 0
          }
        }
      ],
      scattergeo: [
        {
          type: 'scattergeo',
          marker: {colorbar: {
              ticks: '',
              outlinewidth: 0
            }}
        }
      ],
      histogram2d: [
        {
          type: 'histogram2d',
          colorbar: {
            ticks: '',
            outlinewidth: 0
          },
          autocolorscale: true
        }
      ],
      scatterpolar: [
        {
          type: 'scatterpolar',
          marker: {colorbar: {
              ticks: '',
              outlinewidth: 0
            }}
        }
      ],
      contourcarpet: [
        {
          type: 'contourcarpet',
          colorbar: {
            ticks: '',
            outlinewidth: 0
          }
        }
      ],
      scattercarpet: [
        {
          type: 'scattercarpet',
          marker: {colorbar: {
              ticks: '',
              outlinewidth: 0
            }}
        }
      ],
      scattermapbox: [
        {
          type: 'scattermapbox',
          marker: {colorbar: {
              ticks: '',
              outlinewidth: 0
            }}
        }
      ],
      scatterpolargl: [
        {
          type: 'scatterpolargl',
          marker: {colorbar: {
              ticks: '',
              outlinewidth: 0
            }}
        }
      ],
      scatterternary: [
        {
          type: 'scatterternary',
          marker: {colorbar: {
              ticks: '',
              outlinewidth: 0
            }}
        }
      ],
      histogram2dcontour: [
        {
          type: 'histogram2dcontour',
          colorbar: {
            ticks: '',
            outlinewidth: 0
          },
          autocolorscale: true
        }
      ]
    },
    layout: {
      geo: {
        bgcolor: 'white',
        showland: true,
        lakecolor: 'white',
        landcolor: 'white',
        showlakes: true,
        subunitcolor: '#C8D4E3'
      },
      font: {color: '#2a3f5f'},
      polar: {
        bgcolor: 'white',
        radialaxis: {
          ticks: '',
          gridcolor: '#EBF0F8',
          linecolor: '#EBF0F8'
        },
        angularaxis: {
          ticks: '',
          gridcolor: '#EBF0F8',
          linecolor: '#EBF0F8'
        }
      },
      scene: {
        xaxis: {
          ticks: '',
          gridcolor: '#DFE8F3',
          gridwidth: 2,
          linecolor: '#EBF0F8',
          zerolinecolor: '#EBF0F8',
          showbackground: true,
          backgroundcolor: 'white'
        },
        yaxis: {
          ticks: '',
          gridcolor: '#DFE8F3',
          gridwidth: 2,
          linecolor: '#EBF0F8',
          zerolinecolor: '#EBF0F8',
          showbackground: true,
          backgroundcolor: 'white'
        },
        zaxis: {
          ticks: '',
          gridcolor: '#DFE8F3',
          gridwidth: 2,
          linecolor: '#EBF0F8',
          zerolinecolor: '#EBF0F8',
          showbackground: true,
          backgroundcolor: 'white'
        }
      },
      title: {x: 0.05},
      xaxis: {
        ticks: '',
        gridcolor: '#EBF0F8',
        linecolor: '#EBF0F8',
        automargin: true,
        zerolinecolor: '#EBF0F8',
        zerolinewidth: 2
      },
      yaxis: {
        ticks: '',
        gridcolor: '#EBF0F8',
        linecolor: '#EBF0F8',
        automargin: true,
        zerolinecolor: '#EBF0F8',
        zerolinewidth: 2
      },
      ternary: {
        aaxis: {
          ticks: '',
          gridcolor: '#DFE8F3',
          linecolor: '#A2B1C6'
        },
        baxis: {
          ticks: '',
          gridcolor: '#DFE8F3',
          linecolor: '#A2B1C6'
        },
        caxis: {
          ticks: '',
          gridcolor: '#DFE8F3',
          linecolor: '#A2B1C6'
        },
        bgcolor: 'white'
      },
      colorway: ['#636efa', '#EF553B', '#00cc96', '#ab63fa', '#19d3f3', '#e763fa', '#fecb52', '#ffa15a', '#ff6692', '#b6e880'],
      hovermode: 'closest',
      colorscale: {
        diverging: [['0', '#8e0152'], ['0.1', '#c51b7d'], ['0.2', '#de77ae'], ['0.3', '#f1b6da'], ['0.4', '#fde0ef'], ['0.5', '#f7f7f7'], ['0.6', '#e6f5d0'], ['0.7', '#b8e186'], ['0.8', '#7fbc41'], ['0.9', '#4d9221'], ['1', '#276419']],
        sequential: [['0', '#0508b8'], ['0.0893854748603352', '#1910d8'], ['0.1787709497206704', '#3c19f0'], ['0.2681564245810056', '#6b1cfb'], ['0.3575418994413408', '#981cfd'], ['0.44692737430167595', '#bf1cfd'], ['0.5363128491620112', '#dd2bfd'], ['0.6256983240223464', '#f246fe'], ['0.7150837988826816', '#fc67fd'], ['0.8044692737430168', '#fe88fc'], ['0.8938547486033519', '#fea5fd'], ['0.9832402234636871', '#febefe'], ['1', '#fec3fe']],
        sequentialminus: [['0', '#0508b8'], ['0.0893854748603352', '#1910d8'], ['0.1787709497206704', '#3c19f0'], ['0.2681564245810056', '#6b1cfb'], ['0.3575418994413408', '#981cfd'], ['0.44692737430167595', '#bf1cfd'], ['0.5363128491620112', '#dd2bfd'], ['0.6256983240223464', '#f246fe'], ['0.7150837988826816', '#fc67fd'], ['0.8044692737430168', '#fe88fc'], ['0.8938547486033519', '#fea5fd'], ['0.9832402234636871', '#febefe'], ['1', '#fec3fe']]
      },
      plot_bgcolor: 'white',
      paper_bgcolor: 'white',
      shapedefaults: {
        line: {width: 0},
        opacity: 0.4,
        fillcolor: '#506784'
      },
      annotationdefaults: {
        arrowhead: 0,
        arrowcolor: '#506784',
        arrowwidth: 1
      }
    },
    themeRef: 'PLOTLY_WHITE'
  },
  showlegend: true,
  bargroupgap: ''
};
Plotly.plot('plotly-div', {
  data: data,
  layout: layout
});