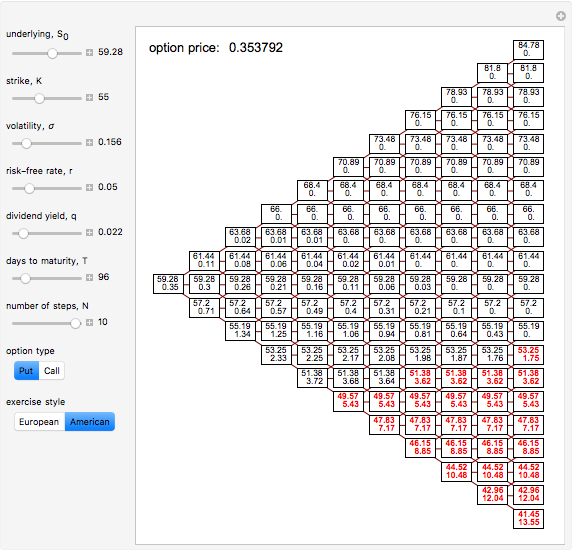
I working on a project, and want to map out some trinomial trees like the one in the link. I cannot figure out how to approach graphing this, and was wondering how one might go about doing this with plotly/dash. It’s graphing a tree lattice that seems to be the challenging part about graphing this, as well as it being challenging to determine in what format the input should be, considering one could use a pandas df or one of numpys arrays as well. Thanks for reading.