Hi,
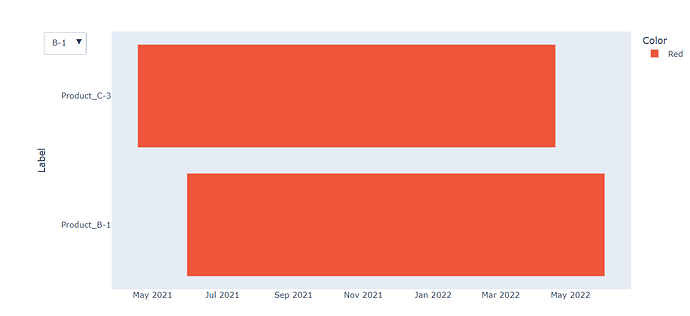
I have been trying to update the timeline as per the selected item from dropdown but it is not getting plotted as per the selected option. For example, in attached image i have selected B1 but C1 is extra here. This is the attached function. I have tried printing x list too, for B1 it gives [False True False False False False False False False False]. Only 1 true at 2nd location, I am not sure where this C1 is coming from. Results get worst when i chose the options below B1. First figure shows dataframe used.
def multi_plot2(df, addAll = True):
button_all = dict(label = 'All',
                  method = 'update',
                  args = [{'visible': df.columns.isin(df.columns),
                           'title': 'All',
                           'showlegend':True}])

def create_layout_button(column):
    labels=np.array(df['Label'])
    x=np.zeros(labels.size)
    i=0
    for s in labels:
        if column in s:
            print (s)
            x[i]=1
        i=i+1

    x=x.astype(np.bool)
    print(x)

    return dict(label = column,
                method = 'restyle',
                args = [{'visible': x,
                         'showlegend': True}])

fig2.update_layout(
    updatemenus=[go.layout.Updatemenu(
        active = 0,
        buttons = ([button_all] * addAll) + list(df['Combined'].map(lambda column: create_layout_button(column)))
        )
    ])
fig2.show()

