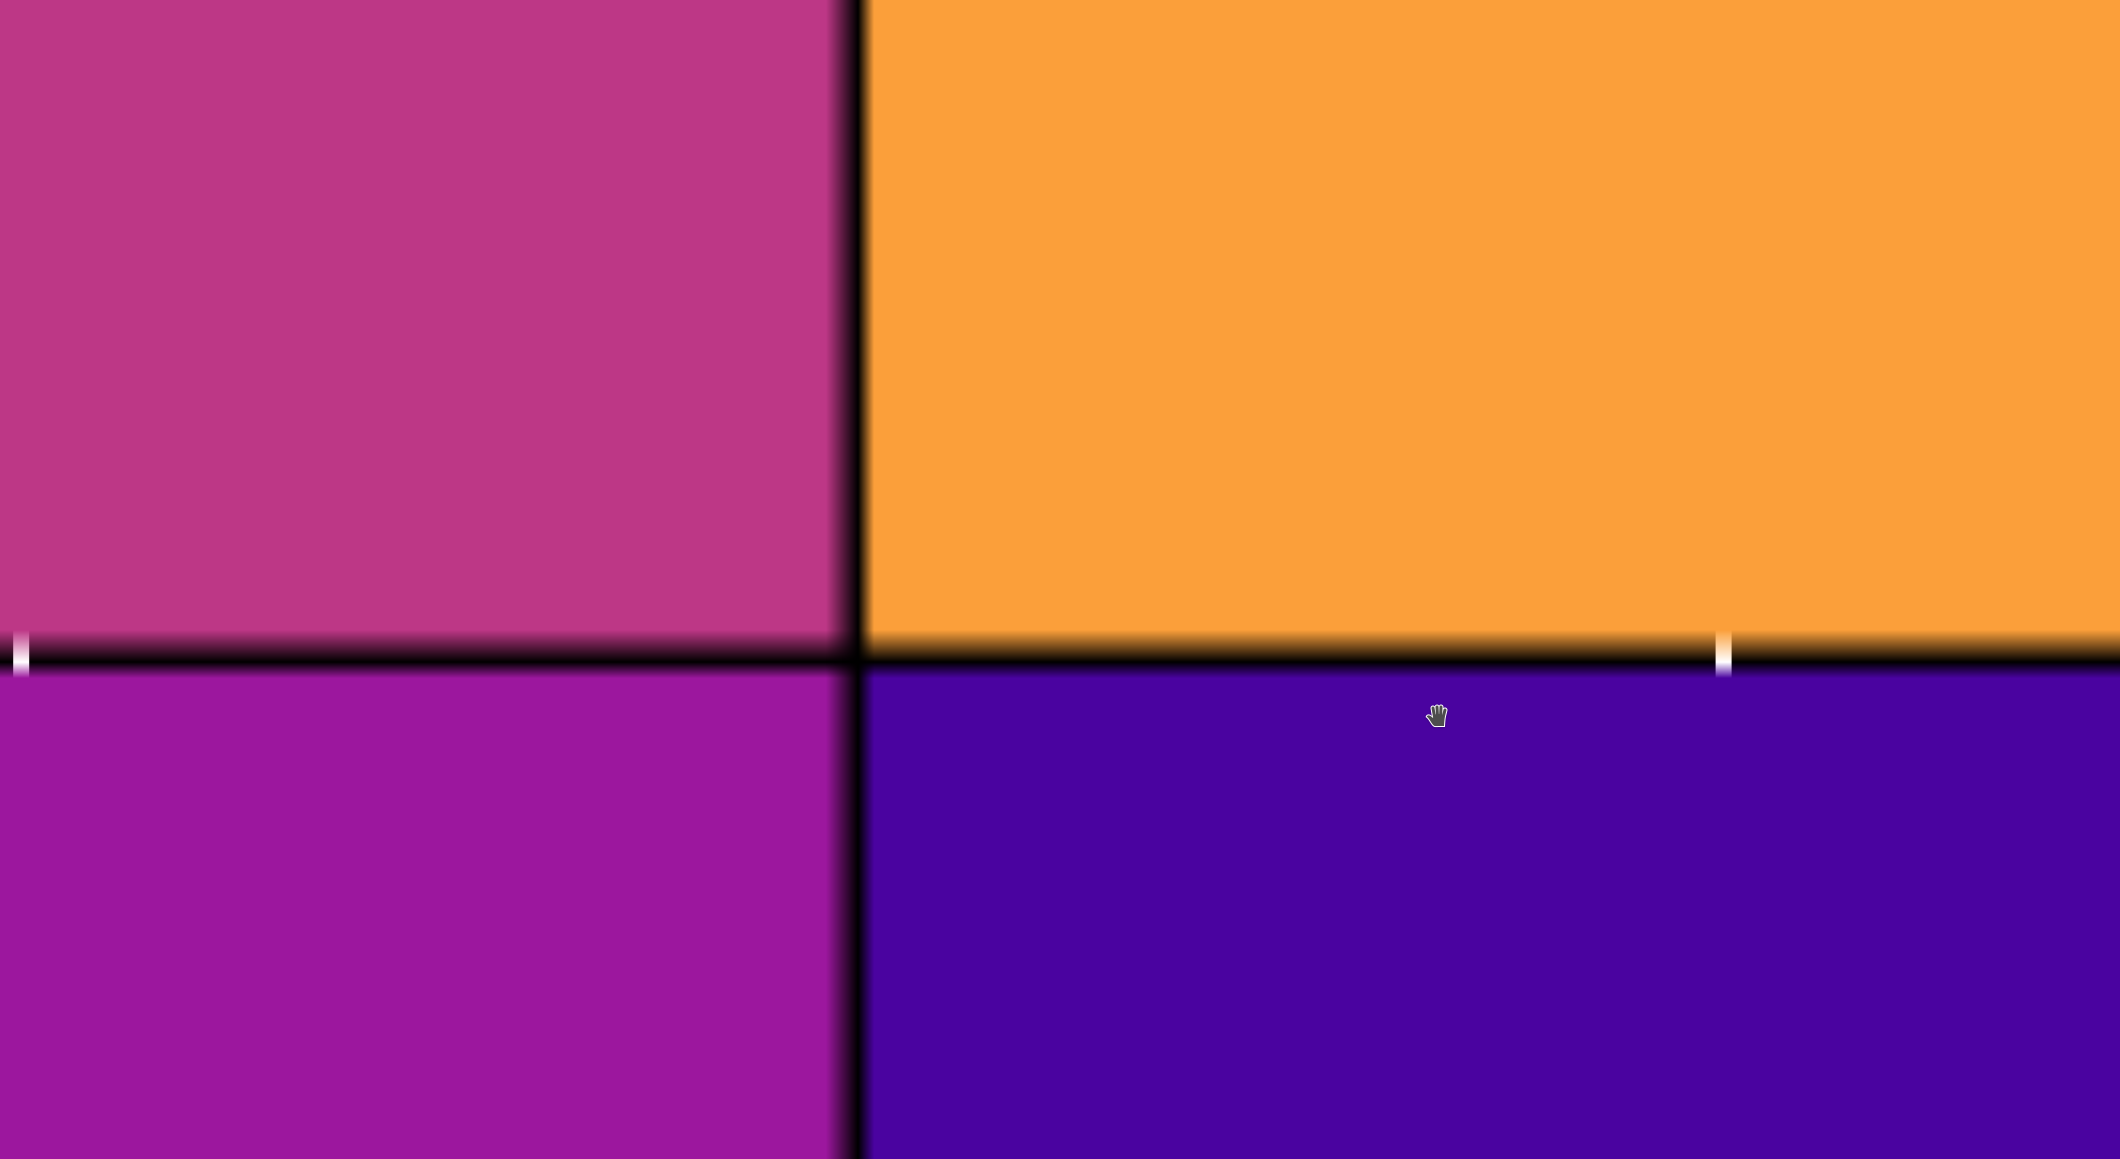
Hi, when setting xgap and/or ygap in a heatmap and exporting as pdf or svg it appears that the tiles have a slight “shadow” on the edges upon zooming.
I would just like to know it there is something in the setting that can get rid of it.
how it looks in pdf:

how it looks in svg:
import plotly.graph_objects as go

fig = go.Figure(data=go.Heatmap(
                   z=[[1, None, 30, 50, 1], [20, 1, 60, 80, 30], [30, 60, 1, -10, 20]],
                   x=['Monday', 'Tuesday', 'Wednesday', 'Thursday', 'Friday'],
                   y=['Morning', 'Afternoon', 'Evening'],
                   hoverongaps = False, zauto=False, xtype="scaled", ytype="scaled",
                   xgap=1.5, ygap=1.5))
fig.update_layout({'paper_bgcolor':'rgba(200,0,0,0)',
  'plot_bgcolor':'#000',
  'modebar_bgcolor':"#FFF",})
fig.show()
fig.write_image("heatmap.svg")
fig.write_image("heatmap.pdf")
Thanks