I have the following image which is a simple five day ohlc chart.
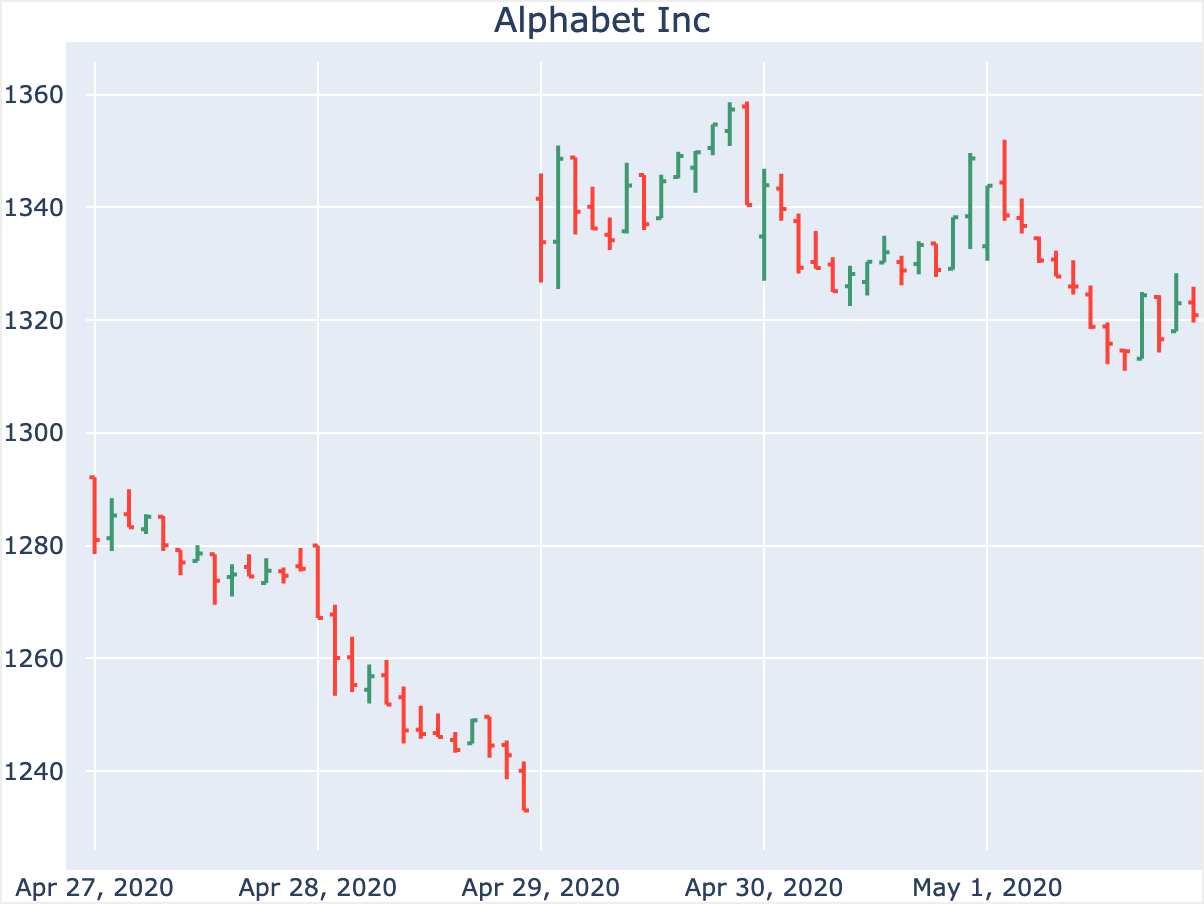
The ticklabel makes some sense that the period begins on the tickmark but for a daily ohlc graph, it would make more sense for the ticklabel/date to be placed between the tickmark and the following tickmark. Is there any way to make such an adjustment?
I thought of this strategy to use blank labels on the edges and create a new tickval in the center. The two problems with that are 1) I don’t want the tickline in the center and 2) cases like this where there are and odd number of lines (13 - every 30 minutes) so the middle bar will not be directly between the start and end ticklines.
