It’s often said that a picture is worth a thousand words, and this is especially true for data visualization. Sometimes you have a perfect reference image for a chart you want to build.
This got me wondering: Can Plotly Studio build a chart just by looking at a picture? I decided to put it to the test using two different methods: a public URL and a Base64 string.
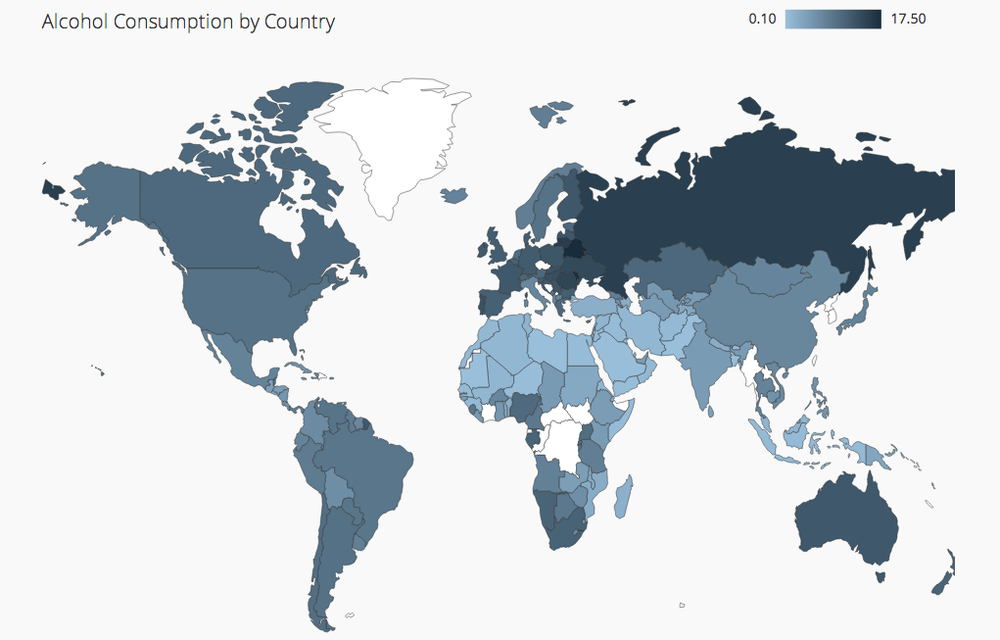
My goal was to use the Billboard Hot 100 dataset to create a map chart that mimics the style of this reference image I found online:
The Methods
I tested two ways to provide this image to Plotly Studio:
Using a URL: A direct, public link to the image.
Using Base64: Converting the image into a long text string and pasting it directly into the prompt.
The Prompt
I used the exact same prompt for both tests, asking Plotly Studio to create the chart and use the image as a style guide:
Artist demographics distribution as a map chart with toggles for gender and race categories and a dropdown to filter by time period (1950s-2020s). Take this picture as a reference and use the same colors as in the picture.
The Results
The results were impressive! Both methods produced nearly identical charts that closely followed the style of the reference image.
Both methods work perfectly for guiding Plotly Studio’s design. However, my recommendation is to use the URL method whenever possible. The Base64 string is functional but extremely long and difficult to manage within the prompt. Combining an explicit prompt with a reference image is a powerful technique for getting the exact chart you need.
@andguez Since you’re covering this very fertile ground … what about this sophisticated stock viz?
the page even has a nice description that you could do as a prompt:
visualize data that includes PE (Price to Earnings) and PB (Price to Book) band multipliers, monthly revenue, and big shareholder holding rates. To achieve this, we can use Plotly, which offers powerful and interactive plotting capabilities.
Here’s an example to create a combined chart using Plotly:
Plot PE and PB Band Multipliers:
Use a line chart to show the PE and PB band multipliers over time.
Monthly Revenue:
Use a bar chart to show monthly revenue.
Big Shareholder Holding Rate:
Use a line chart to show the holding rate of big shareholders over time.
I did what you mentioned. I’ve provided a link and a picture to give you context for what I’m trying to achieve. My main question is: can Studio create a dashboard that looks like the one in the picture? to answer that question what I did was to provide the image and the text to the context and it generate the app
As a next step, I added three sample charts to the app: one containing just a URL, another with just text, and a final one with both.
The output was close to what was request, however, It can be improved.


