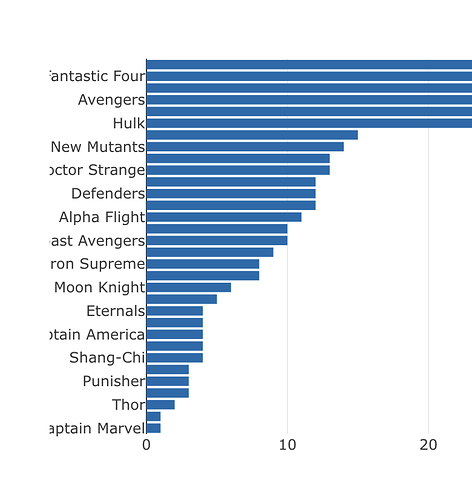
I noticed that if I use the none template, axis labels appear to get cropped in the plot. This doesn’t happen if I use the other themes/templates. Is there a graph property I can adjust to avoid this behavior?
Here’s my simple bar chart, and in the screenshot below you can see where some labels are cut off:
fig = px.bar(
    title_group_cnt,
    x='Count',
    y='Title Group',
    template='none'
)
