My Dash app is having a problem showing candlestick chart in subplot. It sometimes show unrelated candlesticks inside the same subplot and mess up the chart. When I zoom in, those candlesticks remain, and there’s no data showing if I hover above them, unlike the real (proper) candlesticks. I test showing the same data on Jupyter Notebook, and I have no problem at all.
Be low is the screenshot:
The same screenshot zoomed in, showing clearly the strange group of candlesticks:
This is the same data in Jupyter, no such problem at all:
Is this a known bug? How can I work this out?
hi @uzimaster
 welcome to the community.
Can you please share a minimal working example - some code that we can run on our computers and replicate the error you’re getting?
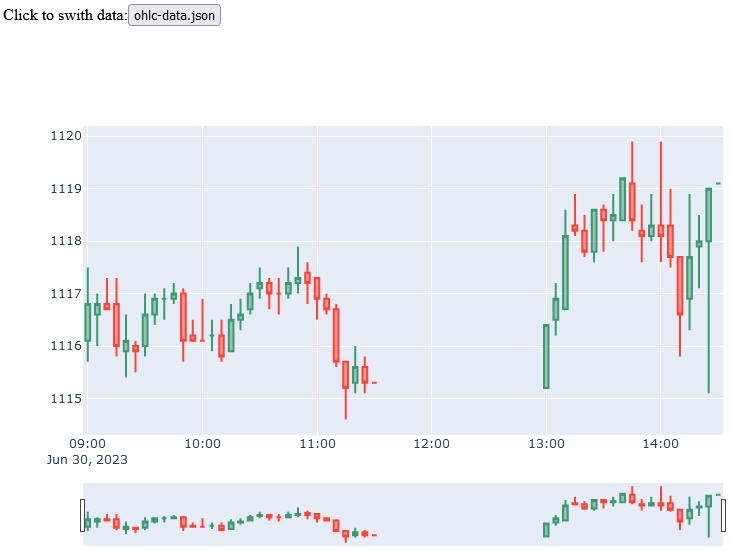
I prepared a minimal example here: GitHub - tariusagi/plotly-dash-lab: A repo for experimenting with Plotly and Dash. Run by “python ohlc-test.py”. There’re 2 data file: the “ohlc-data.json” is the good one, with data from 9:00 to 14:30. The “ohlc-data1.json” has half session, from 13:00. They’re not from the same date.
When I switch the chart’s data between these files, the candles get messed up badly. Tested with scatter (lines mode) and OHLC (bar chart), both worked perfectly.
Below are the screenshots from this minimal code:
It seems that my issue was opened by someone else in Dec, 2020: [BUG] Candlestick chart is not cleared properly when updated with callback · Issue #5316 · plotly/plotly.js · GitHub, but still remained unassigned. Could you please look into this?
Thanks for adding your comment to that GitHub issue, @uzimaster .
Our team should look at it this week. I’ll have more information to share later Thursday or Friday.
1 Like
Hi @adamschroeder , have your team got any progress on this?
hi @uzimaster
unfortunately, no progress on this specific issue since we are prioritizing other bugs currently. Tomorrow, we’ll update the issues with a possible timeline.
Timeline set for Github issue.
1 Like
Fyi, I found a Github dicussion here React bug with Candlestick · Issue #4729 · plotly/plotly.js · GitHub, and after dropping NaN from dataframe using dropna, my problem was solved. Well, almost, because weird candlestick sometime still show up at the noon break (11:30:00 - 13:00:00) of my trading session. I believe that it has something to do with my rangebreaks=[{'bounds' : [11.5, 13], 'pattern' : "hour"}],. Anyway, it’s much better now.
It really seems that NaN or Null values mess up candlestick (but not with OHLC).
1 Like