Hello,
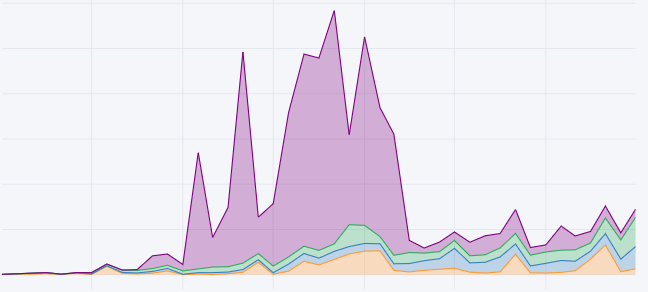
I’m trying to create a stacked area graph, similar to what cufflinks creates using df.iplot(kind=‘area’,barmode=‘stack’,fill=True), graph below;

How do I achieve this and create it on Dash?
Hello,
I’m trying to create a stacked area graph, similar to what cufflinks creates using df.iplot(kind=‘area’,barmode=‘stack’,fill=True), graph below;

How do I achieve this and create it on Dash?
You can achieve this by making a simple Scatter Plot using Plot.ly, and then set the option “fill” and set it to either ‘tozeroy’ or to ‘tonext’.
See documentation here:
See simple Plot.ly Scatter Plot exampels here: