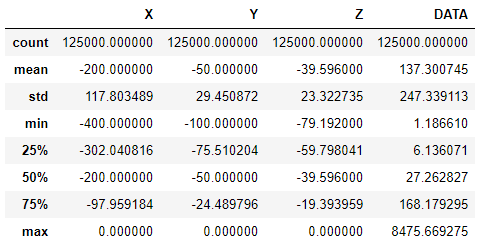
Hi guys, what is the best way to render a 3d Volume plot? Im reading a CSV file (125000 lines), and it takes several seconds to render it.
The quality is really good and it´s just what I need. But I wish I could speed up the rendering time.
I know the time it takes to render depends on the number of surfaces_counts, but even just one surface is taking some time.

fig.add_trace(go.Volume(
visible=True,
x=-cube[‘X’],
y=cube[‘Y’],
z=cube[‘Z’],
showscale=True,
colorscale=[
[int_rel_1, color_1],
[int_rel_2, color_2],
[int_rel_3, color_3],
[int_rel_4, color_4],
[int_rel_5, color_5],
[int_rel_6, color_6],
[int_rel_7, color_7],
[int_rel_8, color_8],
[int_rel_9, color_9],
[int_rel_10, color_10],
[int_rel_11, color_11],
[int_rel_12, color_12],
[int_rel_13, color_13],
[int_rel_14, color_14],
[int_rel_15, color_15],
[int_rel_16, color_16],
[int_rel_17, color_17],
],
cmin=0,
cmax=1000,
value=cube[‘DATA’],
isomin=cube[‘DATA’].min(),
isomax=cube[‘DATA’].max(),
#opacity=0.2, # needs to be small to see through all surfaces
opacityscale=[[0, 0.2],
[0.2, 0.4],
[0.4, 0.6],
[0.6, 0.8],
[0.8, 0.9],
[1, 1]
                         ],
            surface_count=30, # needs to be a large number for good volume rendering
            surface_show=True,
            contour=dict(show=True),
            flatshading=True,
            #spaceframe_show=True,
            caps= dict(x_show=True, y_show=True, z_show=True), # no caps
            #slices_y=dict(show=True, locations=[50])
            ))