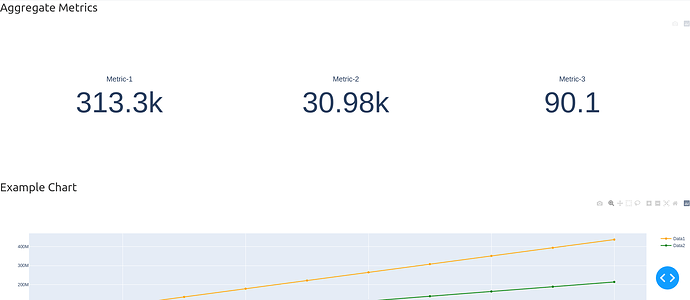
I am trying to size a plotly chart in dash and no matter where I apply the sizing property, it is cropping the chart rather than resizing it. I am really missing something here. The original metrics plot looks like the below image
When I try the style: height property, I see this -
The code I used for the metrics plot is given below:
html.Div([html.H2("Aggregate Metrics"),
                    dcc.Graph(
                        figure=push_metrics()
                        )
]
)
def push_metrics():
    fig = go.Figure()

    a = 313,300
    b = 30,980

    fig.add_trace(go.Indicator(
        title = "Metric-1",
        mode = "number",
        value = a,
        domain = {'row': 0, 'column': 0}))

    fig.add_trace(go.Indicator(
        title = "Metric-2",
        mode = "number",
        value = b,
        domain = {'row': 0, 'column': 1}))

    fig.add_trace(go.Indicator(
        title = "Metric-3",
        mode = "number",
        value = round((a-b)*100/a,2),
        domain = {'row': 0, 'column': 2}))

    fig.update_layout(grid = {'rows':1, 'columns':3, 'pattern':"independent"})

    return fig
I tried applying the style property to the graph at dcc.graph, at html.Div, at fig.update_layout. No matter where I apply it, the plot gets cropped instead of resizing.


