Hi,
Newbie here. I am looking to structure my dashboard’s with Bootstrap because it is convenient for multi-size screen etc. But I have a hard time implementing the structure I want.
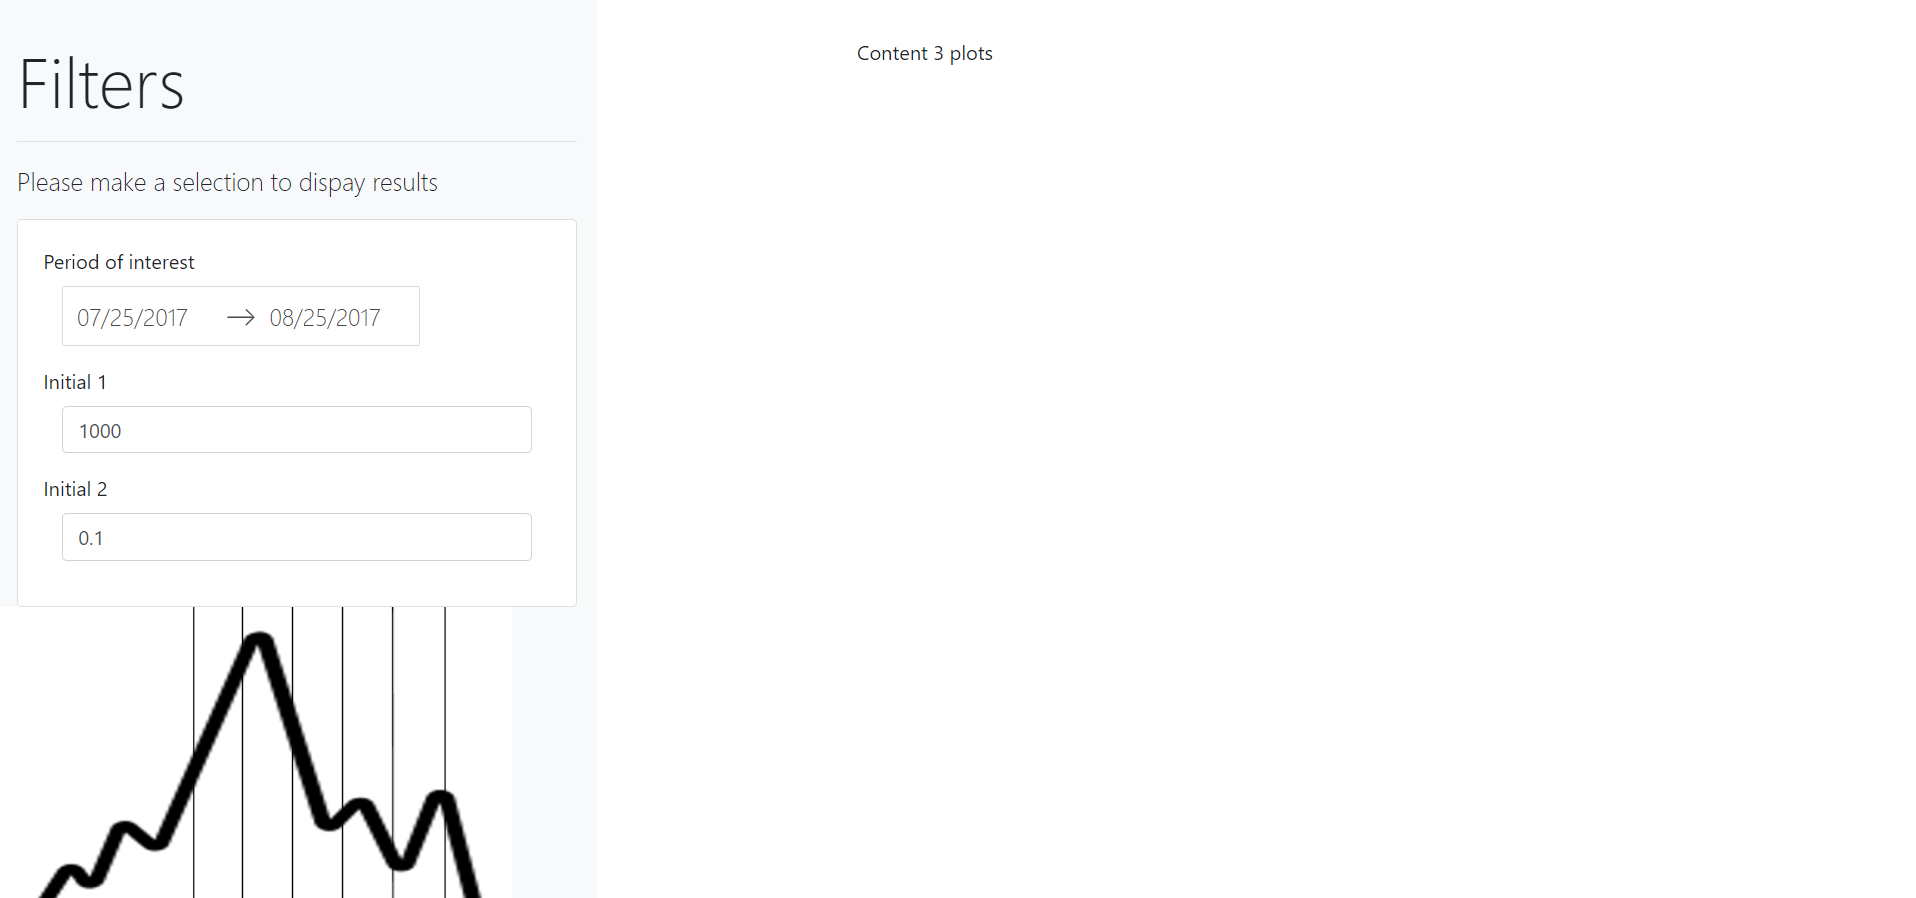
Very basic dashboard : composed of 2 columns. A left and a right column of same length but different width. The left column contains filters + a picture (like a margin). The right column contains 3 superposed time series plots (like the app’s content).
The issue is that I do not find an easy way to create this structure with Bootstrap because objects on the left and the plots on the right should not be align on a same “dbc.Row”. The 3 plots on the right should have similar sizes and together have the same length than the 2 objects in the left column.
Could you code me a 2 cols dashboard template with Bootstrap ?
Moreover : do you know if there is a Gallery of Dash apps based on Bootstrap somewhere ? So not the original Dash Gallery which is not using Bootstrap. Could be very useful.
Many thanks
Here is a simplified example with 2 objects on the left and 3 objects on the right:
import dash
import dash_core_components as dcc
import dash_html_components as html
import dash_bootstrap_components as dbc
import plotly.graph_objs as go
app = dash.Dash(external_stylesheets=[dbc.themes.BOOTSTRAP])
fig = go.Figure(data=[go.Scatter(x=[1, 2, 3], y=[4, 1, 2])])
app.layout = html.Div(
[

    dbc.Row(

        [

            dbc.Col(

                dcc.Graph(figure=fig),

                width=4

            ),

            dbc.Col(

                dcc.Graph(figure=fig),

                width=8

            )

        ],

        align="center",

    ),

    dbc.Row(

        [

            dbc.Col(

                dcc.Graph(figure=fig),

                width=4

            ),

            dbc.Col(

                [

                    dbc.Row(

                        dcc.Graph(figure=fig)

                    ),

                    dbc.Row(

                        dcc.Graph(figure=fig)

                    )

                ],

                width=8

            ),

        ],

        align="center",

    )

],
)
if name == “main”:
app.run_server()