Like many Canadians, I pine for the days of affordable housing. My ineffective antidote has been to visualize Home Price Index (HPI) data from 2005 to 2025 and admire the steep upward trajectory.
App: https://van-isle-housing-prices.plotly.app/
HPI uses statistical methods to track house price changes over time. The data for this application comes from CREA (https://www.crea.ca/housing-market-stats/mls-home-price-index/hpi-tool/). With the help of Plotly Studio, it took me less than 3 minutes to be able to fully appreciate the unsteady but persistent upward trajectory of Vancouver Island real estate.
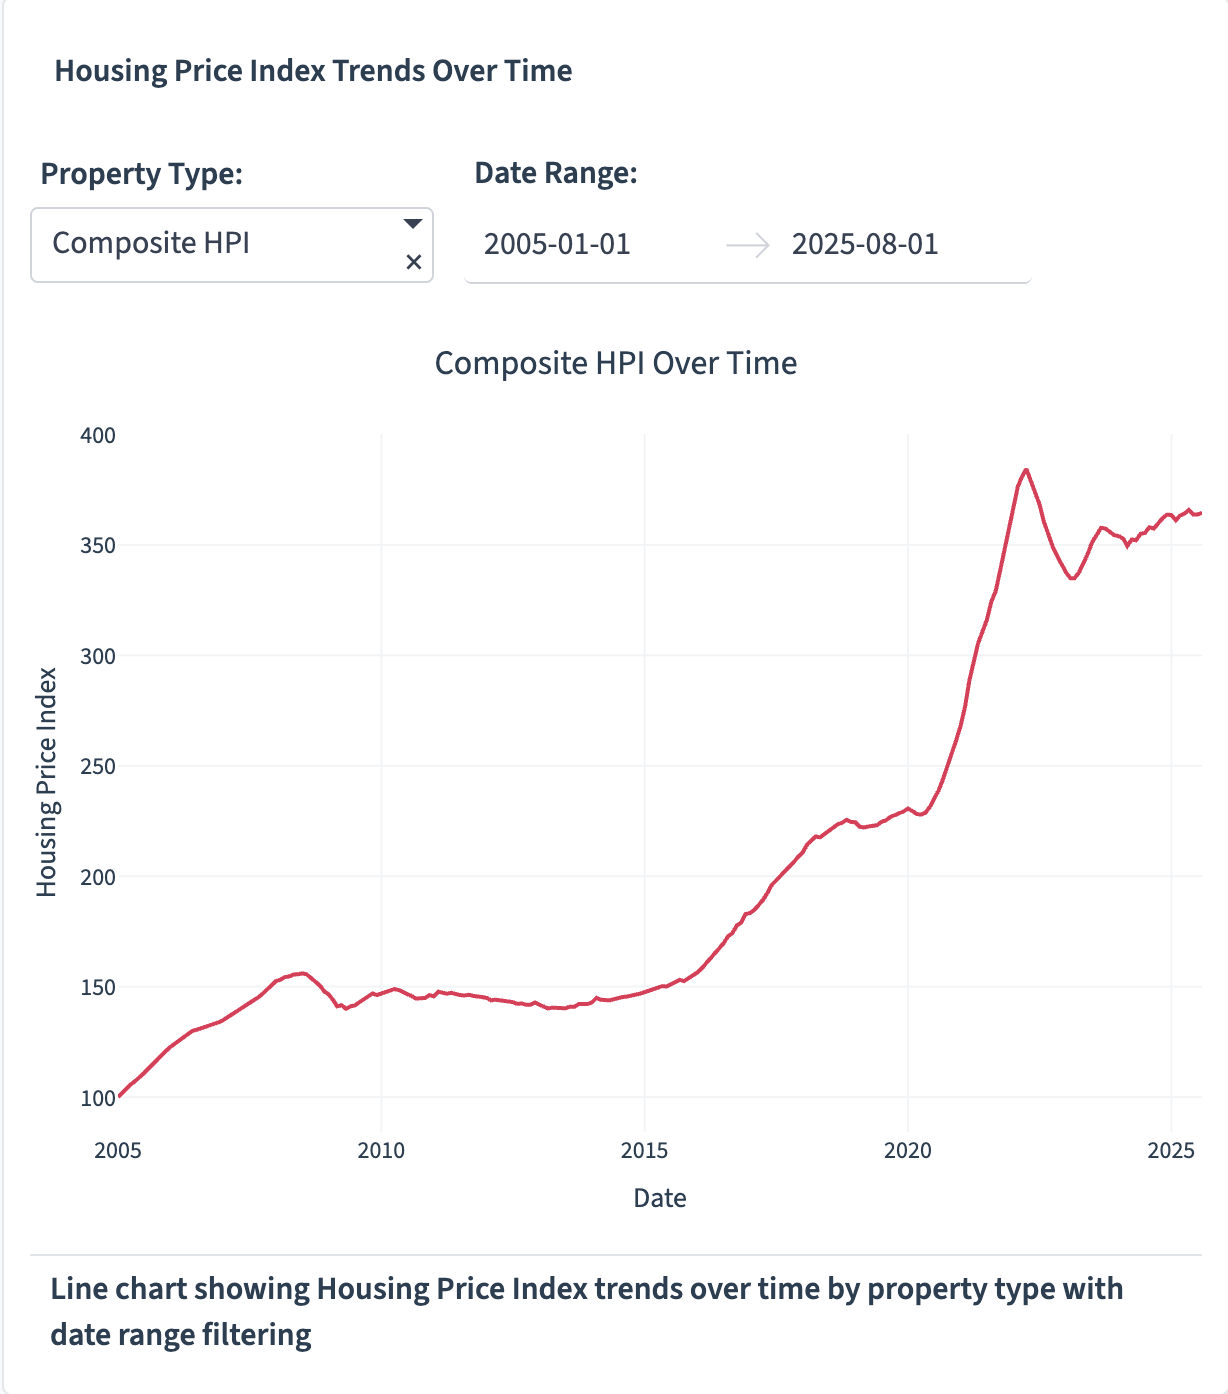
Housing Price Index Over Time
Looking at this visualization, one can see stable housing prices from about 2008 until 2015. After 2015, we see rapid growth followed by a year of stability. At this time, many people in the area said, “Wow, housing is expensive. This is a bubble and can’t last”. However, this thought was quickly proven wrong as we entered the second half of 2020, where the housing market proved that it can, in fact, go much higher.
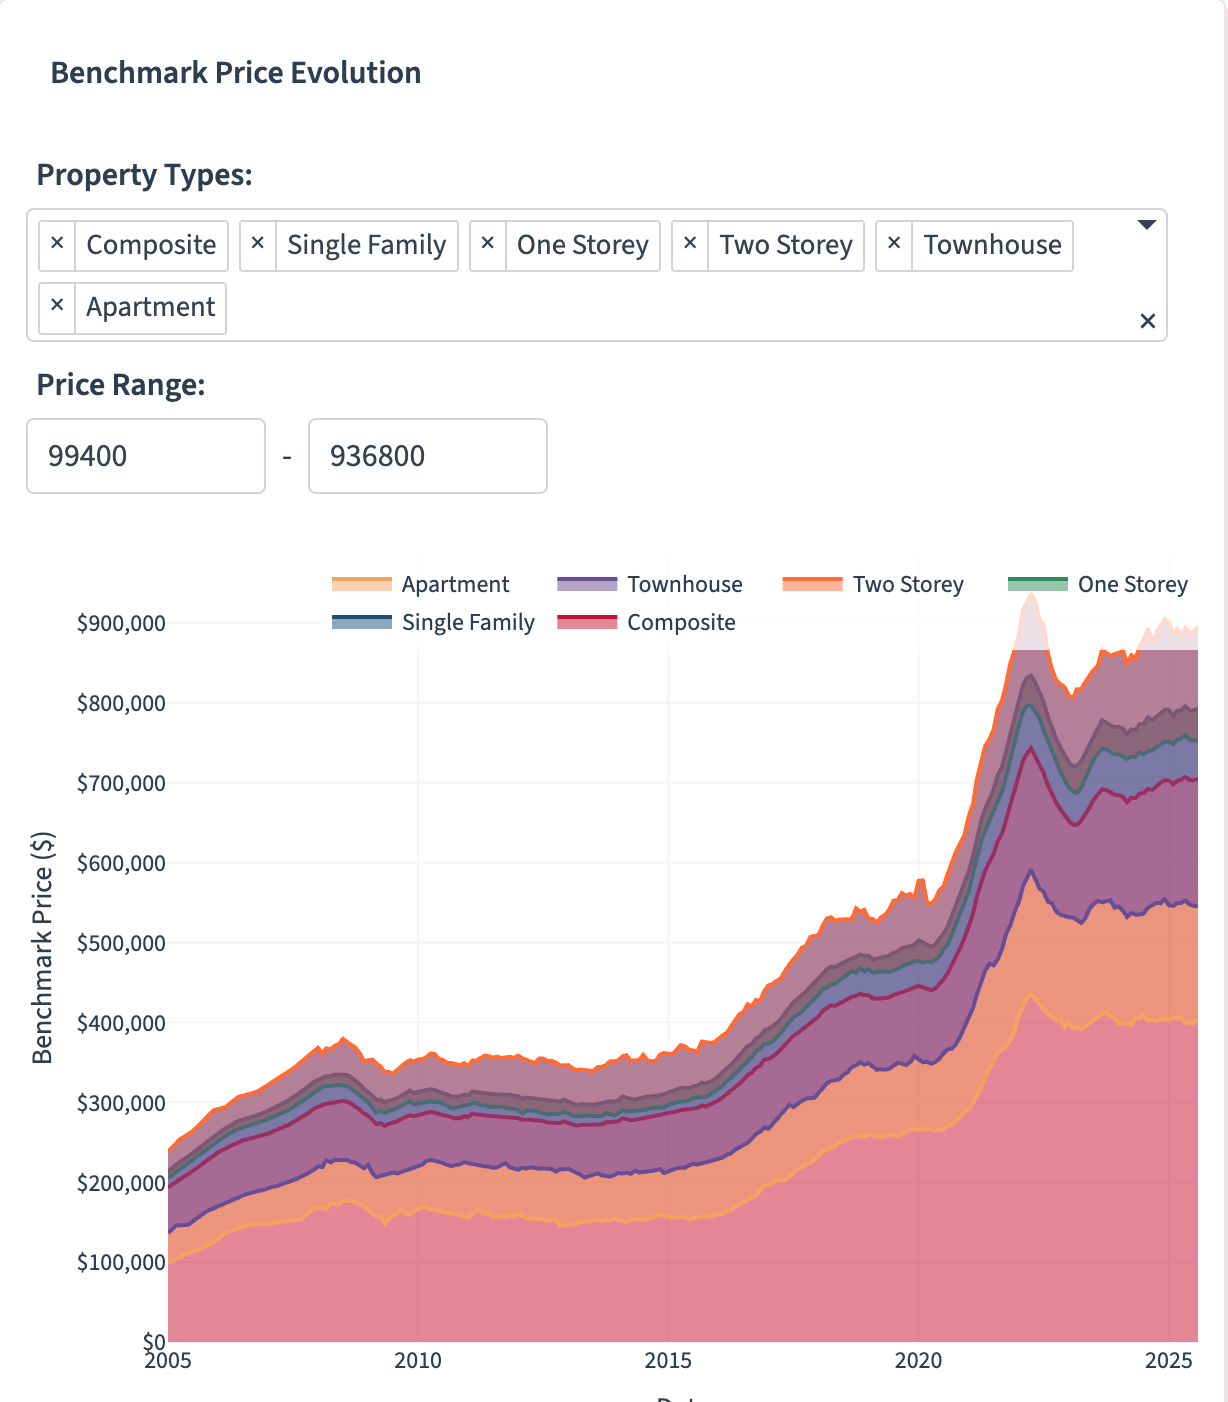
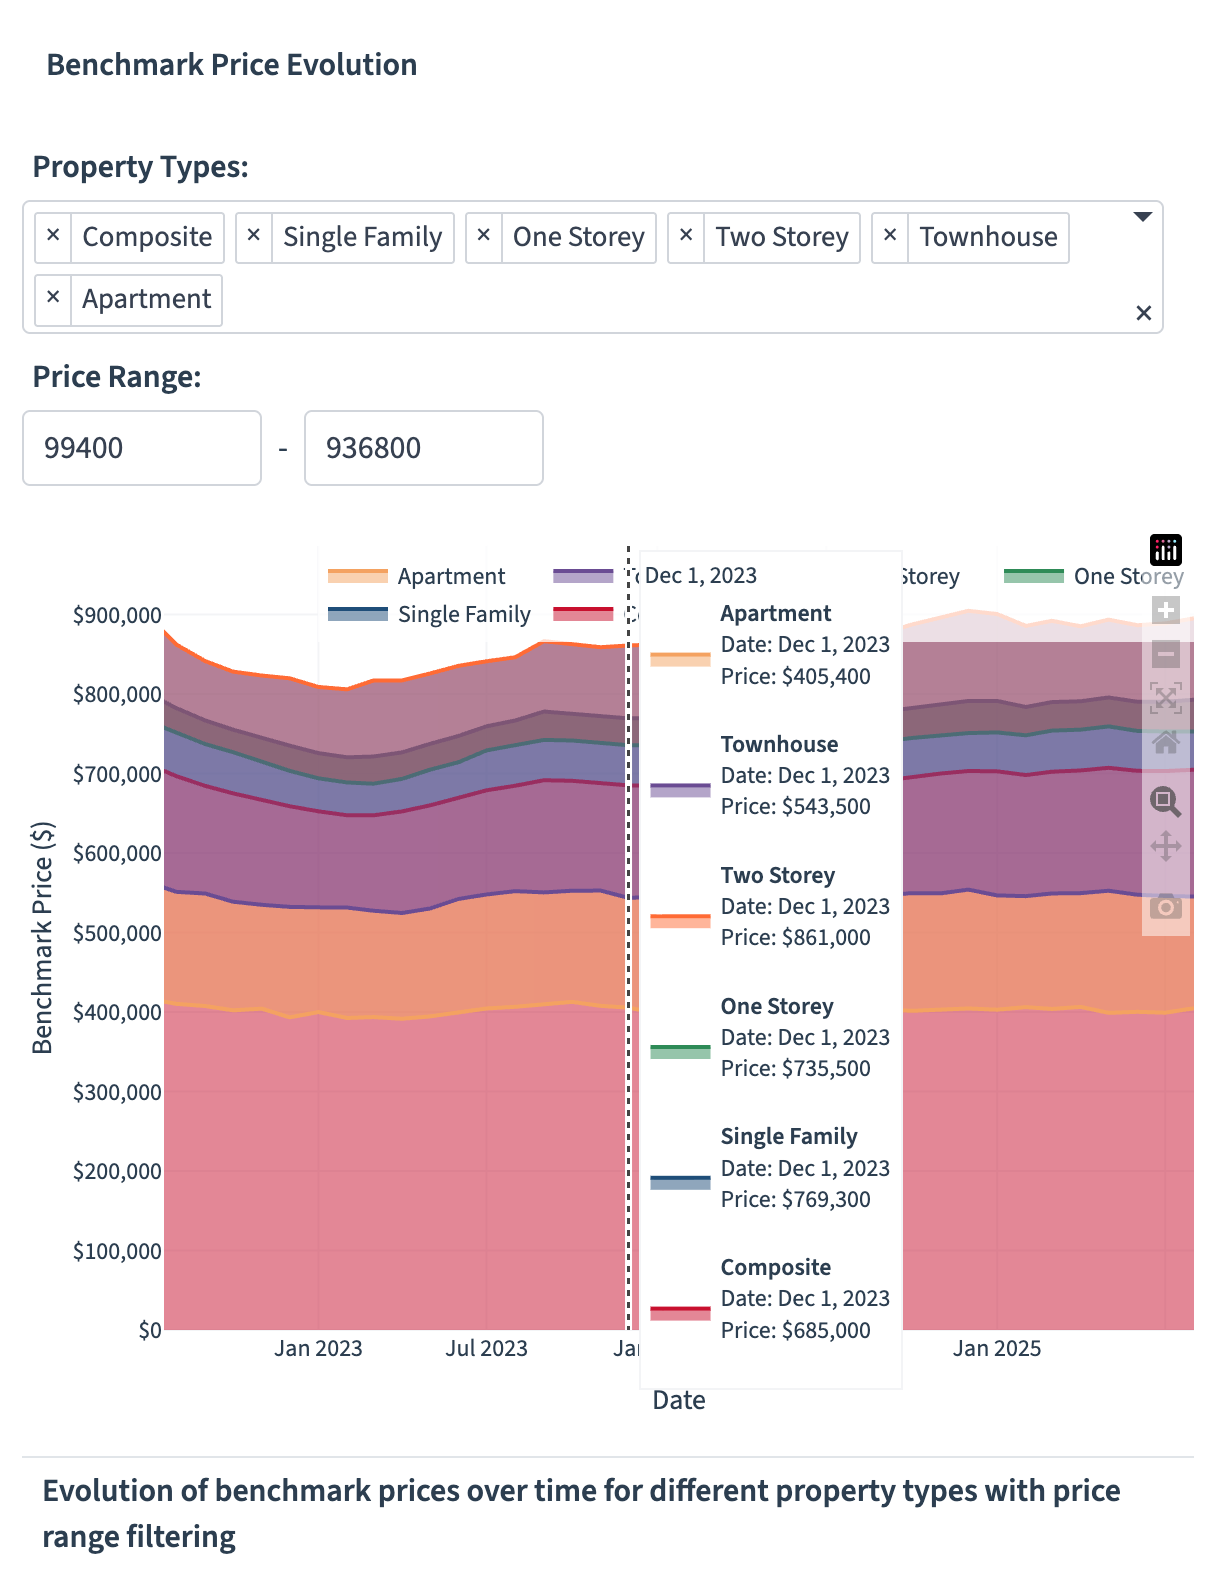
Benchmark Price Evolution
Here we can see that all residential housing types move in unison, and if we hover over the chart, we can see the average price at each time period.
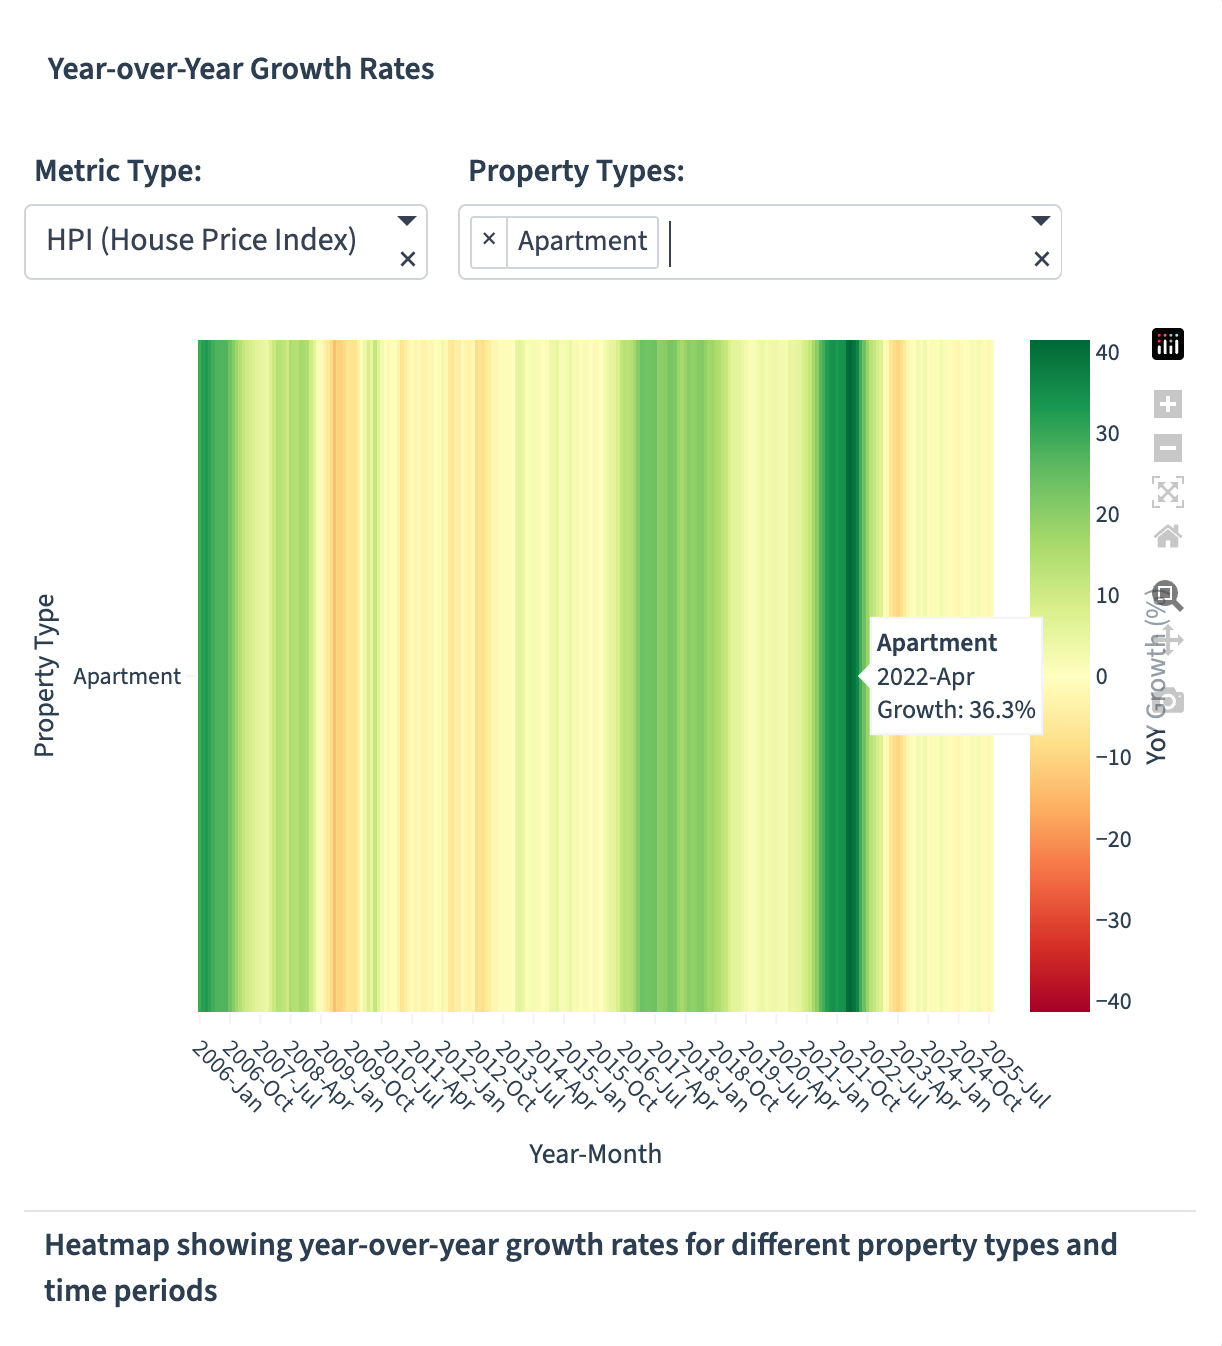
Year-over-Year Growth Rates
Not all years are equal, though. We see years with high growth rates as well as negative growth rates.

Real estate is a roller coaster that not everyone wants to ride. But for those who are trying, the sign that says “you must be this tall to ride” keeps going up and up.