Hi All,
I have developed a versatile API that helps in creating reusable component in Python: GitHub - toltec-astro/dash_component_template: A framework to create reusable Dash layout.
We (The TolTEC project) have been using this for quite a while in our interactive Dash sites, some of which contains a lot of components. You can check some of the pages we developed using this framework and the code behind it here:
site landing page: http://toltecdr.astro.umass.edu
code repo: tolteca/tolteca/web/templates at main · toltec-astro/tolteca · GitHub
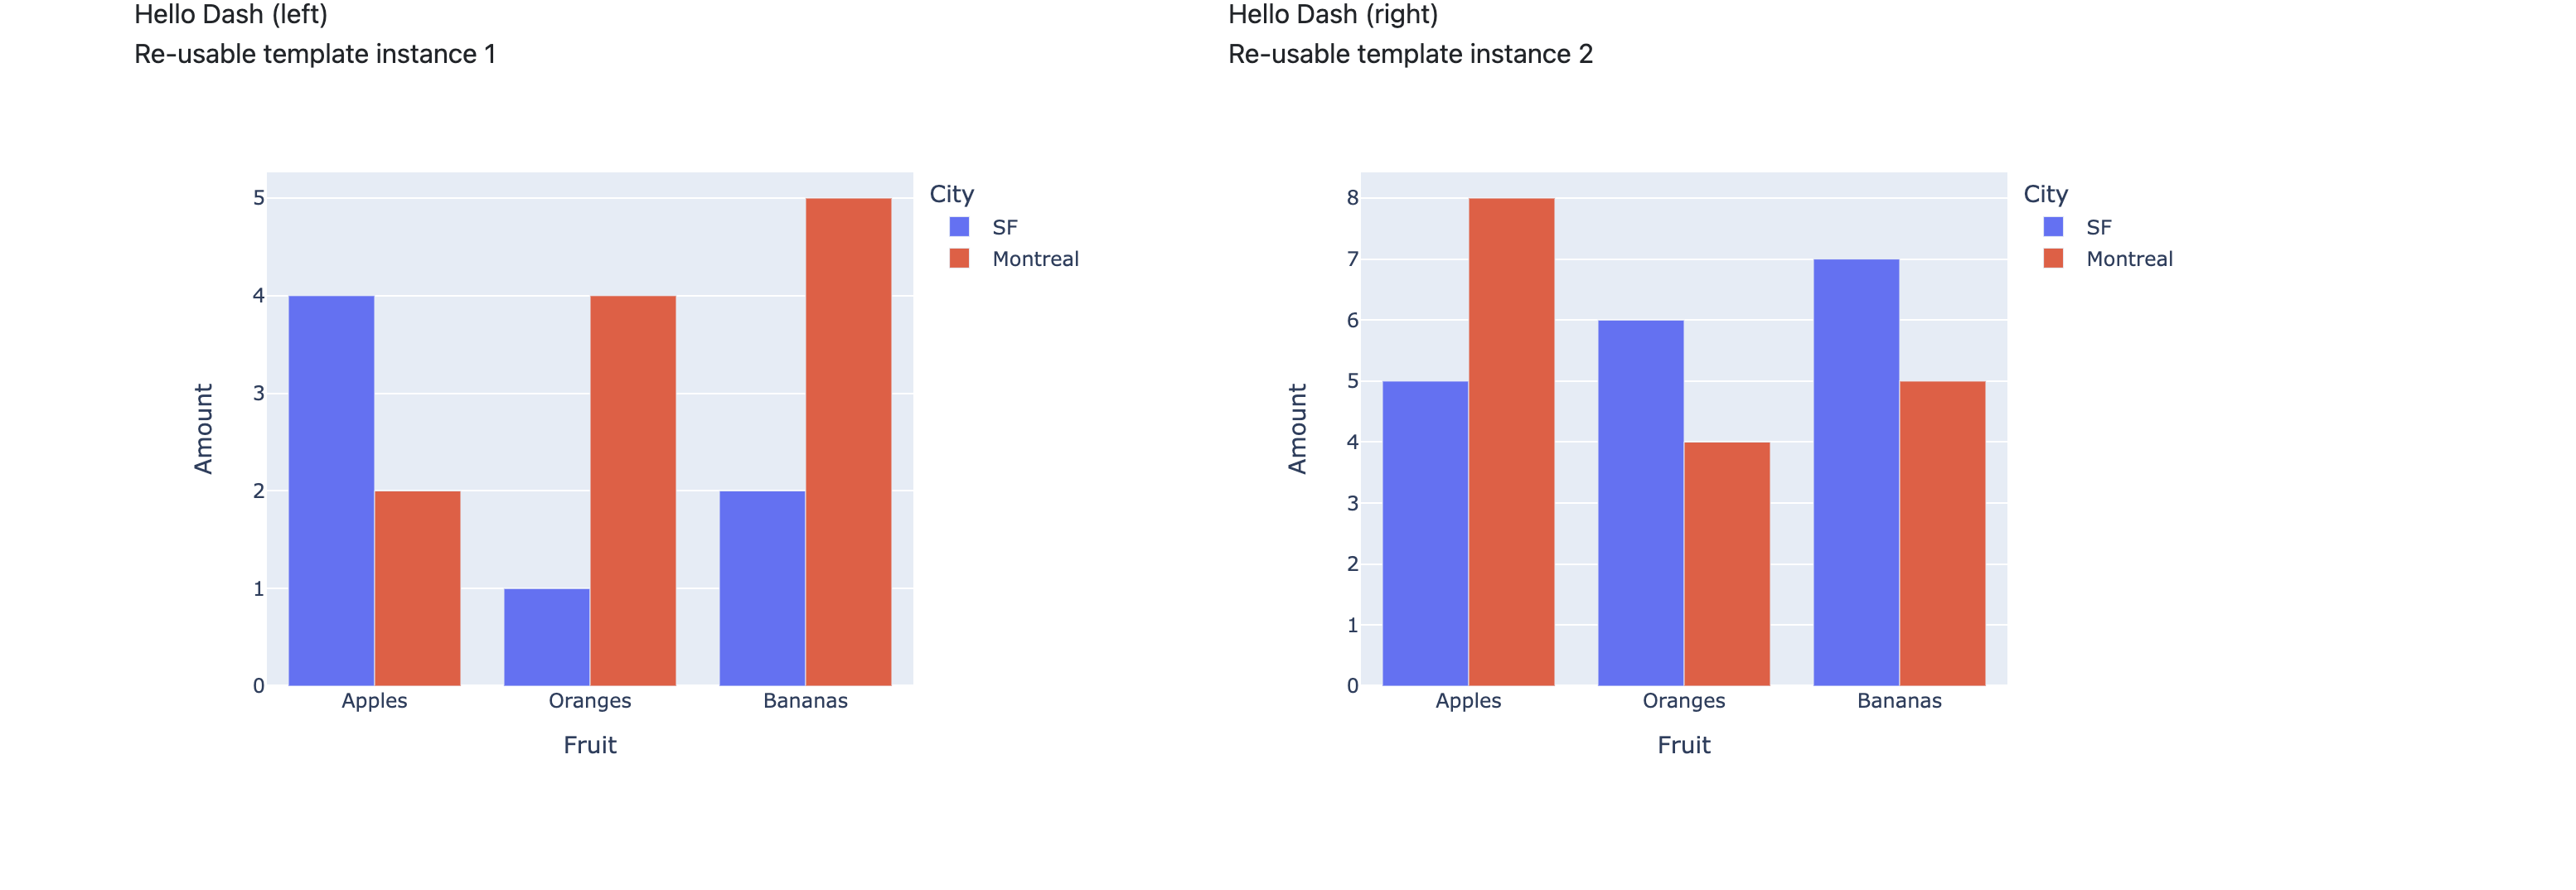
I am attaching an example from the README and the screenshots to show case show powerful it could be in terms of modularizing the Dash layouts and callbacks and creating very complex site with minimum code duplication.
Suppose we have the following Dash app (from Dash tutorial site):
# Run this app with `python app.py` and
# visit http://127.0.0.1:8050/ in your web browser.

import dash
from dash import dcc, html
import plotly.express as px
import pandas as pd

app = dash.Dash(__name__)

# assume you have a "long-form" data frame
# see https://plotly.com/python/px-arguments/ for more options
df = pd.DataFrame({
    "Fruit": ["Apples", "Oranges", "Bananas", "Apples", "Oranges", "Bananas"],
    "Amount": [4, 1, 2, 2, 4, 5],
    "City": ["SF", "SF", "SF", "Montreal", "Montreal", "Montreal"]
})

fig = px.bar(df, x="Fruit", y="Amount", color="City", barmode="group")

app.layout = html.Div(children=[
    html.H1(children='Hello Dash'),

    html.Div(children='''
        Dash: A web application framework for your data.
    '''),

    dcc.Graph(
        id='example-graph',
        figure=fig
    )
])

if __name__ == '__main__':
    app.run_server(debug=True)
Let’s build a new app which have two columns of the same layout.
from dash_component_template import ComponentTemplate
import dash_bootstrap_components as dbc
import pandas as pd
import dash
import plotly.express as px
from dash import html, dcc


# This class defines a template that resembles the Dash example,
# with a title, subtitle, and graph for visualizing a data frame
class MyTableGraph(ComponentTemplate):

    class Meta:
        component_cls = dbc.Container

    def __init__(self, title_text, subtitle_text, df, parent=None):
        super().__init__(parent=parent)
        self._title_text = title_text
        self._subtitle_text = subtitle_text
        self._df = df

    def setup_layout(self, app):
        container = self
        container.child(html.Div, self._title_text)
        container.child(html.Div, self._subtitle_text)
        container.child(dcc.Graph, figure=self._make_fig())
        super().setup_layout(app)
        # any callbacks can be defined here for the components.
        # note that we don't assign the id manually -- they are all automatic
        # to use the id, simply query the `id` property.

    def _make_fig(self):
        return px.bar(
            self._df, x="Fruit", y="Amount", color="City", barmode="group")


# This class defines the app layout which have two columns each column
# contains an instance of the template defined above.

class MyPage(ComponentTemplate):

    class Meta:
        component_cls = dbc.Container

    # define some data
    df1 = pd.DataFrame({
        "Fruit": [
            "Apples", "Oranges", "Bananas", "Apples", "Oranges", "Bananas"],
        "Amount": [4, 1, 2, 2, 4, 5],
        "City": ["SF", "SF", "SF", "Montreal", "Montreal", "Montreal"]
    })

    df2 = pd.DataFrame({
        "Fruit": [
            "Apples", "Oranges", "Bananas", "Apples", "Oranges", "Bananas"],
        "Amount": [5, 6, 7, 8, 4, 5],
        "City": ["SF", "SF", "SF", "Montreal", "Montreal", "Montreal"]
    })

    def setup_layout(self, app):
        col1, col2 = self.grid(nrows=1, ncols=2, squeeze=True)
        col1.child(MyTableGraph(
            df=self.df1,
            title_text='Hello Dash (left)',
            subtitle_text='Re-usable template instance 1'
            ))
        col2.child(MyTableGraph(
            df=self.df2,
            title_text='Hello Dash (right)',
            subtitle_text='Re-usable template instance 2'
            ))
        # this line is important which triggers children's setup_layout
        super().setup_layout(app)


# Now create the app and set the bootstrap css
app = dash.Dash(__name__, external_stylesheets=[dbc.themes.BOOTSTRAP])

# Instantiant the page tempalte, and call the setup layout function
# This only "declare" the structure of the Dash components. No actual
# Dash components are created yet.
page = MyPage()
page.setup_layout(app)
# Create and assign the app layout. The actual creation of Dash components
# are done here.
app.layout = page.layout

if __name__ == '__main__':
    app.run_server(debug=True)
App from Dash tutorial, with native Dash:

Same App with dash_component_template , but with an added layer to show case the power of this package: