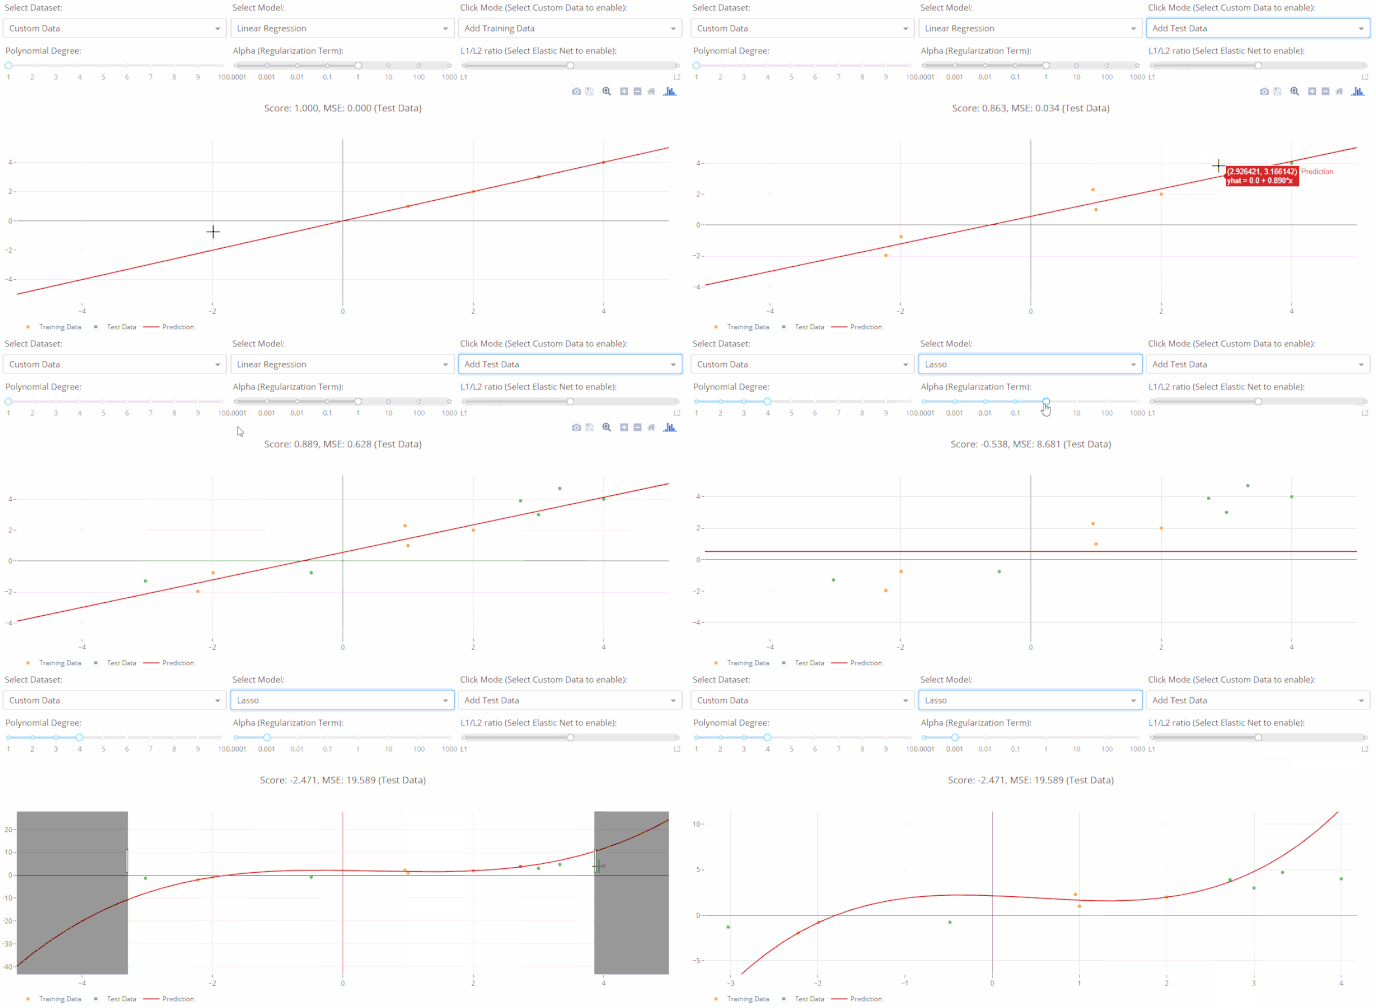
Hey all! I’ve recently completed two apps that lets you explore different parameters for very popular learning algorithms, notably Least-Square regression and SVM Classifiers, through an intuitive UI. They are fully built in Dash (Components, Plotly Graphs, Server) and Scikit-Learn (Datasets, algorithms), limiting the dependencies to what you can easily find in PyPi.
I’d be happy if you give me some feedback on your thoughts, experience on using them, suggestions for future additions, etc. Since it’s an open-source project, you are welcome to fork it and add more features (more parameters to control, more datasets, or maybe even other types of algorithms?). PRs are welcome, and if you wish to make a completely new app let me know!
Dash SVM Explorer
Dash Regression Explorer
Screenshots
SVM app:
Regression app:

