Show and Tell: Dash Grid generator

I am making a package with some higher level abstractions which let you make more in Dash with less code (as derivatives of a larger project), and I pushed the first deliverable component of that today, a Grid generator!

Here is an example usage:
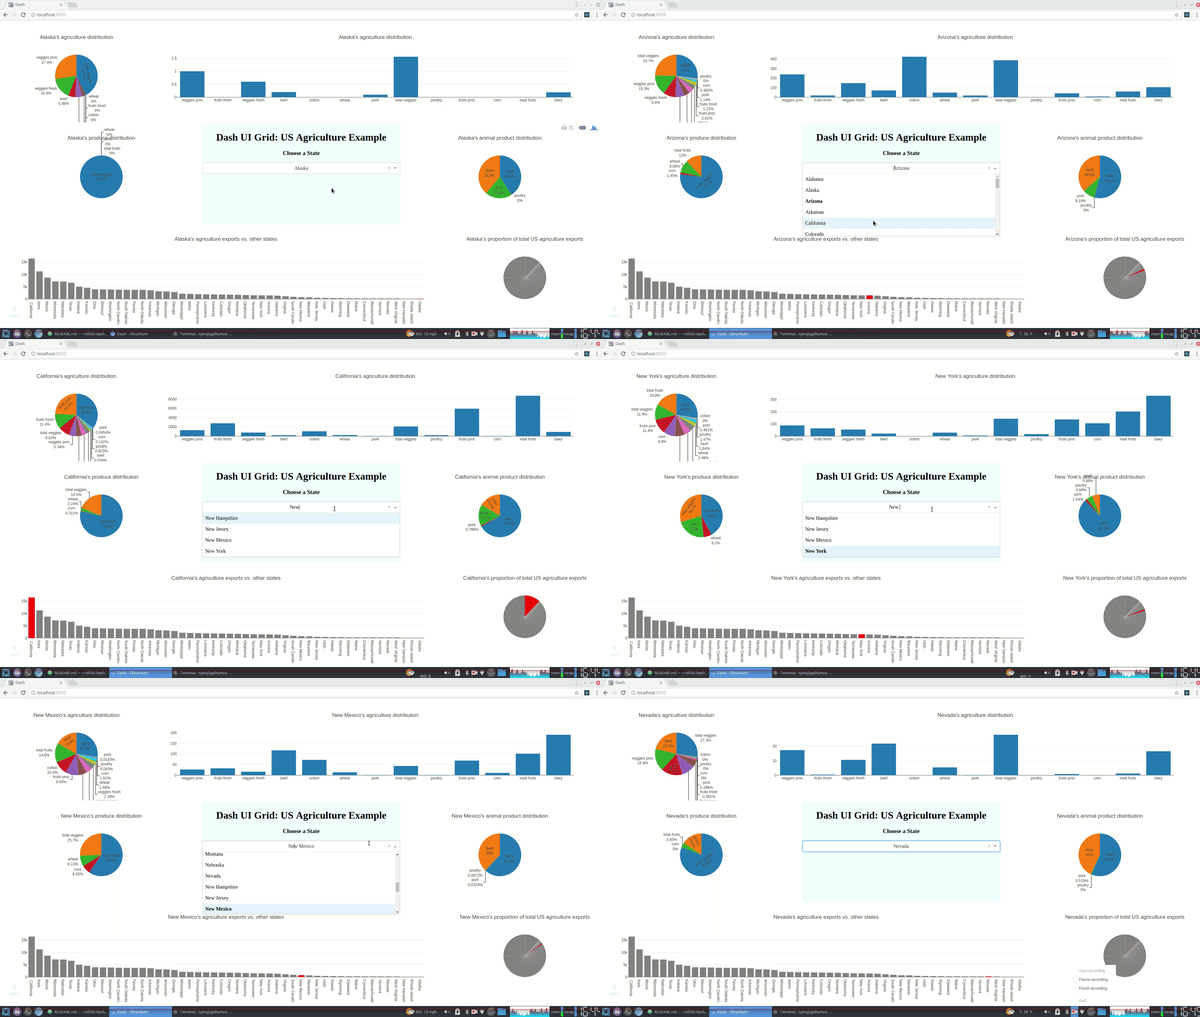
ezgif com-video-to-gif

from dash import Dash
import dash_core_components as dcc
import dash_html_components as html
from dash.dependencies import Input, Output
import dash_ui as dui
import pandas as pd
import plotly.graph_objs as go

df = pd.read_csv(
    'https://gist.githubusercontent.com/chriddyp/'
    'c78bf172206ce24f77d6363a2d754b59/raw/'
    'c353e8ef842413cae56ae3920b8fd78468aa4cb2/'
    'usa-agricultural-exports-2011.csv')

app = Dash()
my_css_urls = [
  "https://codepen.io/rmarren1/pen/mLqGRg.css",
]

for url in my_css_urls:
    app.css.append_css({
        "external_url": url
    })

grid = dui.Grid(grid_id="grid", num_rows=12, num_cols=12, grid_padding=5)

grid.add_graph(col=1, row=1, width=3, height=4, graph_id="all-pie")

grid.add_graph(col=4, row=1, width=9, height=4, graph_id="all-bar")

grid.add_graph(col=1, row=5, width=4, height=4, graph_id="produce-pie")

grid.add_element(
    col=5, row=5, width=4, height=4,
    element=html.Div([
        html.H1("Dash UI Grid: US Agriculture Example"),
        html.H3("Choose a State"),
        dcc.Dropdown(
            id="state-dropdown",
            options=[{'label': x.title(), 'value': x}
                     for x in df["state"].tolist()],
            value=df["state"].tolist()[0])
        ], style={
            "background-color": "Azure",
            "border-radius": "5px",
            "height": "100%",
            "width": "100%",
            "padding": "2px",
            "text-align": "center"})
    )

grid.add_graph(col=9, row=5, width=4, height=4, graph_id="animal-pie")

grid.add_graph(col=1, row=9, width=9, height=4, graph_id="total-exports-bar")

grid.add_graph(col=10, row=9, width=3, height=4, graph_id="total-exports-pie")


app.layout = html.Div(grid.get_component(), style={
    "height": "calc(100vh - 20px)",
    "width": "calc(100vw - 20px)"
})

... plot callbacks ...

if __name__ == "__main__":
    app.run_server(debug=True)

You can download from PyPi: pip install dash-ui
and on GitHub here: GitHub - rmarren1/dash-ui: Some abstractions to make creating UI's easier in Dash

Hope this is useful to someone!
–Ryan
10 Likes

I cant make it work :c

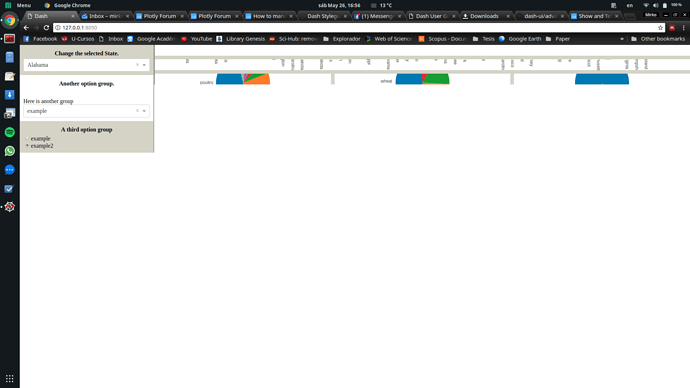
I tried to use the simple and the advanced demo, but the layout doesnt show. The simple demo doesnt show anything and with the advanced one, it just show this:

What could i be doing wrong?

PD: Srry, im new to Dash

What could i be doing wrong?

Did you remember to add the .css styles file?

app = Dash()
my_css_urls = [
  "https://codepen.io/rmarren1/pen/mLqGRg.css",
]

for url in my_css_urls:
    app.css.append_css({
        "external_url": url
    })

Yep, I added the css file.
The thing is that even the demo code in the GitHub doesn’t work for me. Can someone try it?

I already have my dashboard using the common layout format, but I want to give a try to this alternative.

I was working on some changes for a new version and think I accidentally changed the codepen stylesheet for the main branch, apologies!

Now, this library does not require the control panel / grid to take up the entire screen, it just fits 100% of the width and height of its parent div, so the demos are breaking because there is no parent div with a defined height.

To fix this, you can just add a wrapper around the layout object styled to 100vh and 100vw, like so:

html.Div(
    dui.Layout(
        grid=grid,
        controlpanel=controlpanel
    ),
    style={
        'height': '100vh',
        'width': '100vw'
    }
 )	 )

I also just made a commit fixing these in the demos, they should work just fine now.

WOW this is awesome - I have been struggling with grid layouts in dash - and this has changed my life!

much thanks.

Indeed! A year helpfully utility. I ran into a small issue and hoping someone can share a pointer.

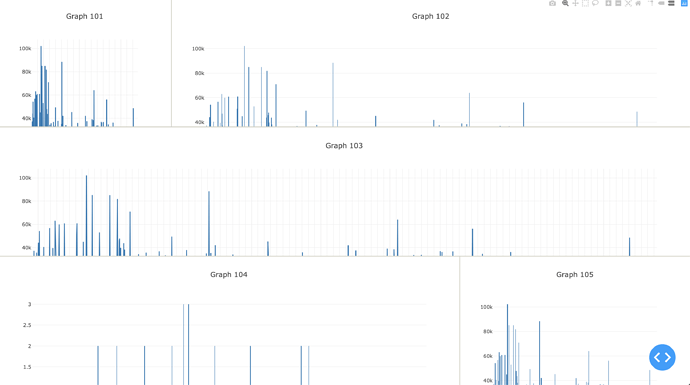
When I add graphs using grid.add_element, the placement is fine but graph size is not optimal (see image). On my MB Pro, I see them cropped. I can scroll within the individual panel but scrolling down his title and other attributes. When I use a high-res external monitor, things seem fine. Any pointers?

I am running into the same issue. Scrolling within graphs. How can I get the graph to fit the screen without scrolling?

On another note, has anyone gotten dash_ui to work with dcc.tabs? I’d like to place tabs in the control panel, but the grid element also opens in the control panel, not the grid side of the display.

Unfortunately it seemsdui no longer works properly. The demo in simple_demo.pyyields an empty page and the code pen for css (https://codepen.io/rmarren1/pen/mLqGRg.css) is 404.

@rnarren1 if it’s a quick fix to get the grid working again and you have time to provide some guidance I would love to submit a PR.

Thanks,
@urig