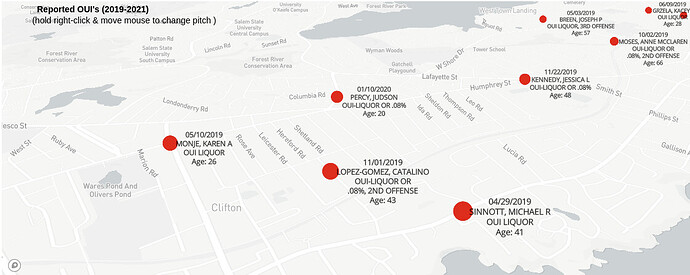
Hey all, I’m pretty new to dash/plotly so forgive me if I’m overlooking anything super obvious, my brain is pretty fatigued rn.
I’m currently trying to feed some latitudes and longitudes from a pandas df onto my map. My problem is that some of these locations have identical coordinates, and that seems to prevent all of the markers from showing up.
I believe this is the case because only the markers who have duplicates are missing, whereas the unique ones display perfectly fine. Only the first of every coordinate that has a duplicate seem to show up on the map.
My dataframe(s) are as follows, but it’s “df2” that is being used to plot my markers
a = Report.query.filter(
    Report.action_taken.contains('arrest')
    )

o = Report.query.filter(
    Report.criminal_charges.contains('OUI'),
    )

df = pd.DataFrame([(d.primary_id) for d in a],columns=['officer'])
df['Frequency'] = df.groupby('officer')['officer'].transform('count')
df.sort_values('Frequency', inplace=True, ascending=False, ignore_index=True)
df.drop_duplicates(inplace=True)
df2 = pd.DataFrame([(d.criminal_name, d.date, d.criminal_charges, d.criminal_age, d.lat, d.lon) for d in o],

columns=[
    'criminal', 'date', 'charges', 'age',  'lat', 'lon'

    ])
As you can see in the output below, the issue of identical coordinates comes from the problem of not having numbered addresses, just the street names.
                                    charges age                     location  \
0                                OUI LIQUOR  58    LINCOLN AVE MARBLEHEAD MA
1                                OUI LIQUOR  18      FOSTER ST MARBLEHEAD MA
2                                OUI LIQUOR  41   ATLANTIC AVE MARBLEHEAD MA
3                   OUI LIQUOR, 3RD OFFENSE  57      SANTRY RD MARBLEHEAD MA
4                                OUI LIQUOR  26    HUMPHREY ST MARBLEHEAD MA
5                                OUI LIQUOR  62    HUMPHREY ST MARBLEHEAD MA
6                                OUI LIQUOR  28       SUSAN RD MARBLEHEAD MA
7                                OUI LIQUOR  70      OCEAN AVE MARBLEHEAD MA
8                        OUI-LIQUOR OR .08%  68   ATLANTIC AVE MARBLEHEAD MA
9                        OUI-LIQUOR OR .08%  51   ATLANTIC AVE MARBLEHEAD MA
10          OUI-LIQUOR OR .08%, 2ND OFFENSE  66      TOWER WAY MARBLEHEAD MA
11                       OUI-LIQUOR OR .08%  51    HUMPHREY ST MARBLEHEAD MA
12                       OUI-LIQUOR OR .08%  60    PLEASANT ST MARBLEHEAD MA
13          OUI-LIQUOR OR .08%, 2ND OFFENSE  43      TRAGER RD MARBLEHEAD MA
14                       OUI-LIQUOR OR .08%  48   LAFAYETTE ST MARBLEHEAD MA
15          OUI-LIQUOR OR .08%, 2ND OFFENSE  32   LAFAYETTE ST MARBLEHEAD MA
16                       OUI-LIQUOR OR .08%  20       MAPLE ST MARBLEHEAD MA
17  LICENSE SUSPENDED FOR OUI, OPER MV WITH  40   LAFAYETTE ST MARBLEHEAD MA
18                       OUI-LIQUOR OR .08%  54  WASHINGTON SQ MARBLEHEAD MA
19          OUI-LIQUOR OR .08%, 3RD OFFENSE  68    PLEASANT ST MARBLEHEAD MA
20                       OUI-LIQUOR OR .08%  71      BEACON ST MARBLEHEAD MA
21                       OUI-LIQUOR OR .08%  23      OCEAN AVE MARBLEHEAD MA
22                       OUI-LIQUOR OR .08%  23   LAFAYETTE ST MARBLEHEAD MA

          lat        lon
0   42.507872 -70.856888
1   42.499097 -70.840096
2   42.484539 -70.872055
3   42.504762 -70.869528
4   42.485911 -70.885297
5   42.485911 -70.885297
6   42.508880 -70.859641
7   42.490394 -70.839959
8   42.484539 -70.872055
9   42.484539 -70.872055
10  42.500561 -70.864274
11  42.485911 -70.885297
12  42.501437 -70.857260
13  42.485496 -70.877513
14  42.493851 -70.870498
15  42.493851 -70.870498
16  42.490404 -70.880278
17  42.493851 -70.870498
18  42.502330 -70.852803
19  42.501437 -70.857260
20  42.514130 -70.858553
21  42.490394 -70.839959
22  42.493851 -70.870498
I’m then iterating over that dataframe and placing markers with the respective coordinates.
date = df2['date']
data = go.Scattermapbox(lon=[df2['lon'][i] for i in range(len(df2))],
                        lat=[df2['lat'][i] for i in range(len(df2))],
                        mode='markers+text',
                        marker=dict(size=25, color='red', allowoverlap=True),
                        textposition='top right',
                        textfont=dict(size=12, color='black'),
                        hovertemplate =
                        "longitude: %{lon}<br>" +
                        "latitude: %{lat}<br>" +
                        "<extra></extra>",
                        text= df2['date'] + "<br>" + df2['criminal'] + "<br>" + df2['charges'] + "<br>" + "Age: " + df2['age'])

fig2 = go.Figure(data=data)

fig2.update_layout(
    title="<br> <b> Reported OUI's (2019-2021)</b><br>(hold right-click & move mouse to change pitch )",
    autosize=True,
    hovermode='closest',
    showlegend=False,
    margin=dict(l=25, t=0, r=25, b=0, pad=0),
    font=dict(
        # family="Courier New, monospace",
        color="#000000",
        size=10
    ),

    mapbox=dict(
        accesstoken=MAPBOX_ACCESS_TOKEN,
        bearing=0,
        center=dict(
            lat=42.4817822,
            lon=-70.8844412
        ),
        pitch=120,
        zoom=14,
        style='light'

    ),
)
The final result looks exactly how I’d like it to, but I’m struggling to find a way of getting these identical markers to show up without having to rebuild my entire database and slightly altering all of the coordinates.
Any help/suggestions are greatly appreciated! 
