hi,
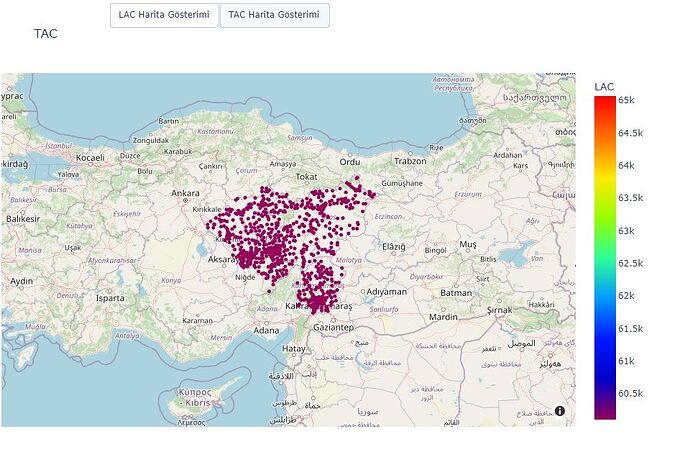
Having two different columns which have different values,name is TAC and LAC. Creating scatter_mapbox two different map and can click buttom, showing diffent location and howover data. But doesnt not change lagend value between two map so doesnt change color.
df1 including some texts which are ‘SITE’, ‘TAC’, ‘PLANNER’, ‘CITY’, ‘CPSUBREGION’,‘LAC’.
TAC-LAC two different value to changing map points colour
Blockquote
style=['open-street-map', 'white-bg', 'carto-positron', 'carto-darkmatter', 'stamen- terrain', 'stamen-toner', 'stamen-watercolor']

color_sytle=['aggrnyl', 'agsunset', 'algae', 'amp', 'armyrose', 'balance',
 'blackbody', 'bluered', 'blues', 'blugrn', 'bluyl', 'brbg',
 'brwnyl', 'bugn', 'bupu', 'burg', 'burgyl', 'cividis', 'curl',
 'darkmint', 'deep', 'delta', 'dense', 'earth', 'edge', 'electric',
 'emrld', 'fall', 'geyser', 'gnbu', 'gray', 'greens', 'greys',
 'haline', 'hot', 'hsv', 'ice', 'icefire', 'inferno', 'jet',
 'magenta', 'magma', 'matter', 'mint', 'mrybm', 'mygbm', 'oranges',
 'orrd', 'oryel', 'oxy', 'peach', 'phase', 'picnic', 'pinkyl',
 'piyg', 'plasma', 'plotly3', 'portland', 'prgn', 'pubu', 'pubugn',
 'puor', 'purd', 'purp', 'purples', 'purpor', 'rainbow', 'rdbu',
 'rdgy', 'rdpu', 'rdylbu', 'rdylgn', 'redor', 'reds', 'solar',
 'spectral', 'speed', 'sunset', 'sunsetdark', 'teal', 'tealgrn',
 'tealrose', 'tempo', 'temps', 'thermal', 'tropic', 'turbid',
 'turbo', 'twilight', 'viridis', 'ylgn', 'ylgnbu', 'ylorbr',
 'ylorrd']

fig = px.scatter_mapbox(df1, lat='LAT', lon='LON',
                        mapbox_style=style[0] ,
                        color_continuous_scale=color_sytle[66],
                        hover_name='SITE', hover_data=['SITE', 'LAC', 'PLANNER', 'CITY', 'CPSUBREGION','TAC'],
                        color="LAC",
                        range_color=(df1["LAC"].min(),df1["LAC"].max()),
                        zoom=5 , height=600, width=900,
                        title="LAC-TAC Mapping Huawei"

                        )


fig.add_trace(px.scatter_mapbox(df1, lat='LAT', lon='LON',
                        mapbox_style=style[0] ,
                        color_continuous_scale=color_sytle[66],
                        hover_name='SITE', hover_data=['SITE','TAC', 'PLANNER', 'CITY', 'CPSUBREGION', 'LAC'],
                        color="TAC",
                        labels=True,
                        range_color=(df1["TAC"].min(),df1["TAC"].max()),
                        zoom=5 , height=600, width=900
                        ).data[0])


fig.update_layout(
    updatemenus=[
        dict(
            type="buttons",
            direction="right",
            active=0,
            x=0.57,
            y=1.2,
            buttons=list([
                dict(label="LAC Harita Gösterimi",
                     method="update",
                     args=[{"visible": [True,False]},
                           {"title": "LAC",
                            "annotations": []}]),

                dict(label="TAC Harita Gösterimi",
                     method="update",
                     args=[{"visible": [False,True]},
                           {"title": "TAC",
                            "annotations": []}]),


            ]),
        )
    ])


fig.update_layout(margin={"r":0,"t":50,"l":0,"b":10})
fig.show()
fig.to_plotly_json()
plot(fig, auto_open=True)

