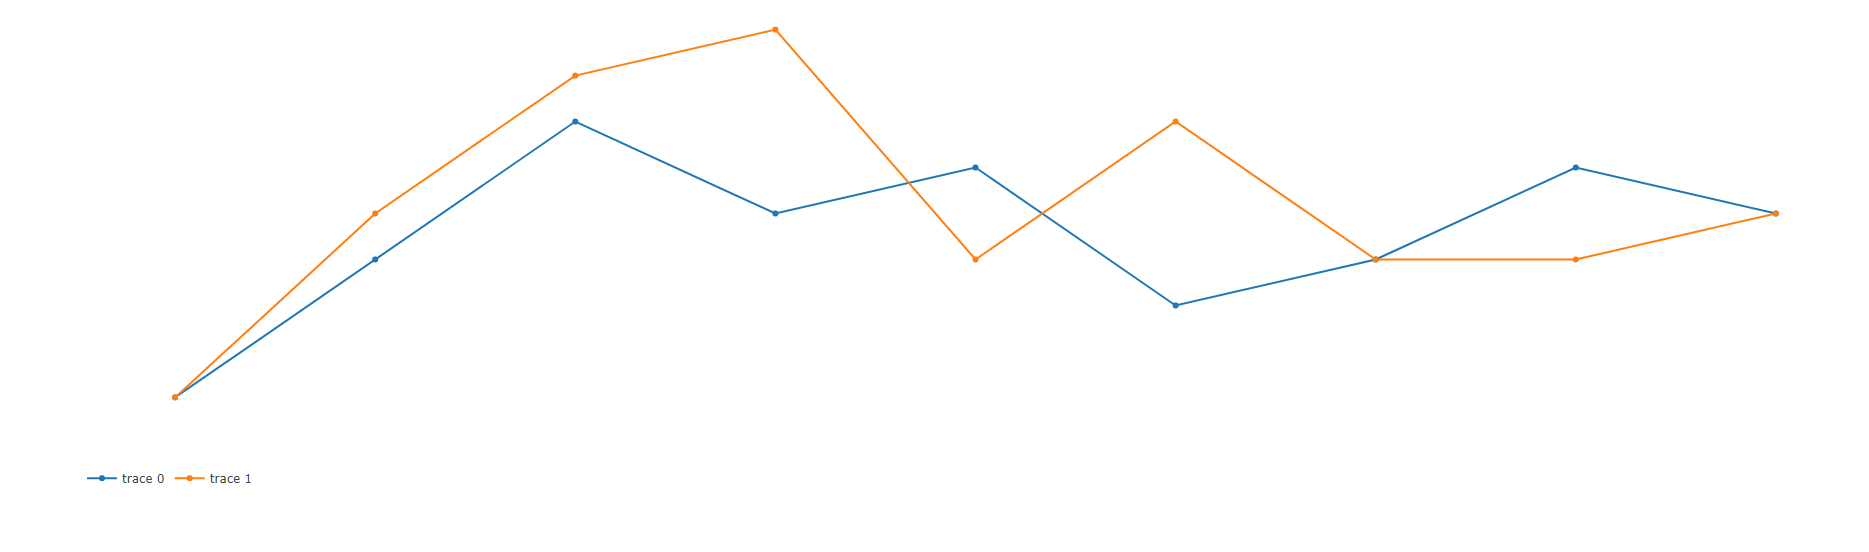
I’ve been browsing the docs and haven’t been able to find a way to shift the plot to the left. My goal is to align the plot with the legend on the left.

The plot was generated with the following code
var trace1 = {
x: [0, 1, 2, 3, 4, 5, 6, 7, 8],
y: [0, 3, 6, 4, 5, 2, 3, 5, 4],
type: ‘scatter’
};
var trace2 = {
x: [0, 1, 2, 3, 4, 5, 6, 7, 8],
y: [0, 4, 7, 8, 3, 6, 3, 3, 4],
type: ‘scatter’
};
var data = [trace1, trace2];
var layout = {
xaxis:{visible:false}, yaxis:{visible:false}, showlegend: true,
legend: {“orientation”: “h”,},
};
// Set ‘h’ for horizontal and ‘v’ for vertical
Plotly.newPlot(‘myDiv’, data, layout);