Rangeselector button callback or persistence wanted

Hi there,

I’m using the rangeselector buttons described here:

I’d like to either:

  1. Persist the state of the rangeselector button clicked, after browser refresh, or…
  2. Assign a callback to the rangeselector button clicked, according to its ID

The first option doesn’t seem to be available, but what about the second? Is there a way to assign an id=“rangeselector_btn_1” or something like that, and then trigger a callback on its “n_clicks” property?

I need one of those two options because I’m charting real time streaming data, and the chart refreshes on an interval. However, the rangeselector value is reset each time the chart is refreshed.

Perhaps there’s a better way to refresh the chart, which persists the user’s chosen rangeselector time range? That would be a third option I guess.

Thanks a lot,
Sean

uirevision is our recommended solution for persisting user interactions between dcc.Graph updates, see 📣 Preserving UI State, like Zoom, in dcc.Graph with uirevision with Dash

Intriguing… but it’s not working for me yet.

I set uirevision=“random_input_property_id” in the graph/figure/layout, expecting it only to reset the rangeselector’s chosen X-axis if that Input(“random_input_property_id”, “value”) triggered the callback, but I guess that’s not right.

In my setup, every time the dcc.Interval fires, an entire dcc.Graph object is returned. Would it work if the dcc.Graph was in the layout, and I only updated, say, the figure property of the dcc.Graph?

Thanks!
Sean

I’ve answered one of my own questions above. Yes, I must update the dcc.Graph's “figure” property, rather than returning a whole new dcc.Graph and expecting the uirevision feature to work.

However, it seems this uirevision feature doesn’t work as expected for the rangeselector buttons in a real-time streaming time series scenario. It does seem to “lock in” the X-axis range that’s set with the rangeselector button (but only if the xaxis.autorange property is True).

For real-time streaming data, I want to lock in a “dynamic range” of, say, the last two minutes, or five minutes, etc. I don’t want to lock in the last two minutes in a fixed time range, and then not show any new data as it arrives…

Here’s my real-time streaming data, for example:

Here’s a workaround I came up with. It’ll take a lot more effort, but at least I can sort of reproduce those nice rangeselector buttons with the following Dash-Bootstrap-Component (dbc) classes/styles:

cn = "mr-1 py-0 px-1"
st = {"font-size": "0.8em"}
cl = 'secondary'

html.Div(
    [
        dbc.Button("2m", id="rt_rng_btn_2m", color=cl, className=cn + " offset-1", style=st),
        dbc.Button("10m", id="rt_rng_btn_10m", color=cl, className=cn, style=st),
        dbc.Button("30m", id="rt_rng_btn_30m", color=cl, className=cn, style=st),
        dbc.Button("1h", id="rt_rng_btn_1h", color=cl, className=cn, style=st),
        dbc.Button("2h", id="rt_rng_btn_2h", color=cl, className=cn, style=st),
        dbc.Button("6h", id="rt_rng_btn_6h", color=cl, className=cn, style=st),
        dbc.Button("all", id="rt_rng_btn_all", color=cl, className=cn, style=st),
    ],
    className="player text-left"
),

Here’s the result. Pretty close in style…

Sean

@seanrez,

I’m trying to do something similar… Do you still have this code?
I’d like to see how do you answer the click buttons to make the rangeselector.

Thanks
Wander

Hi Wander,

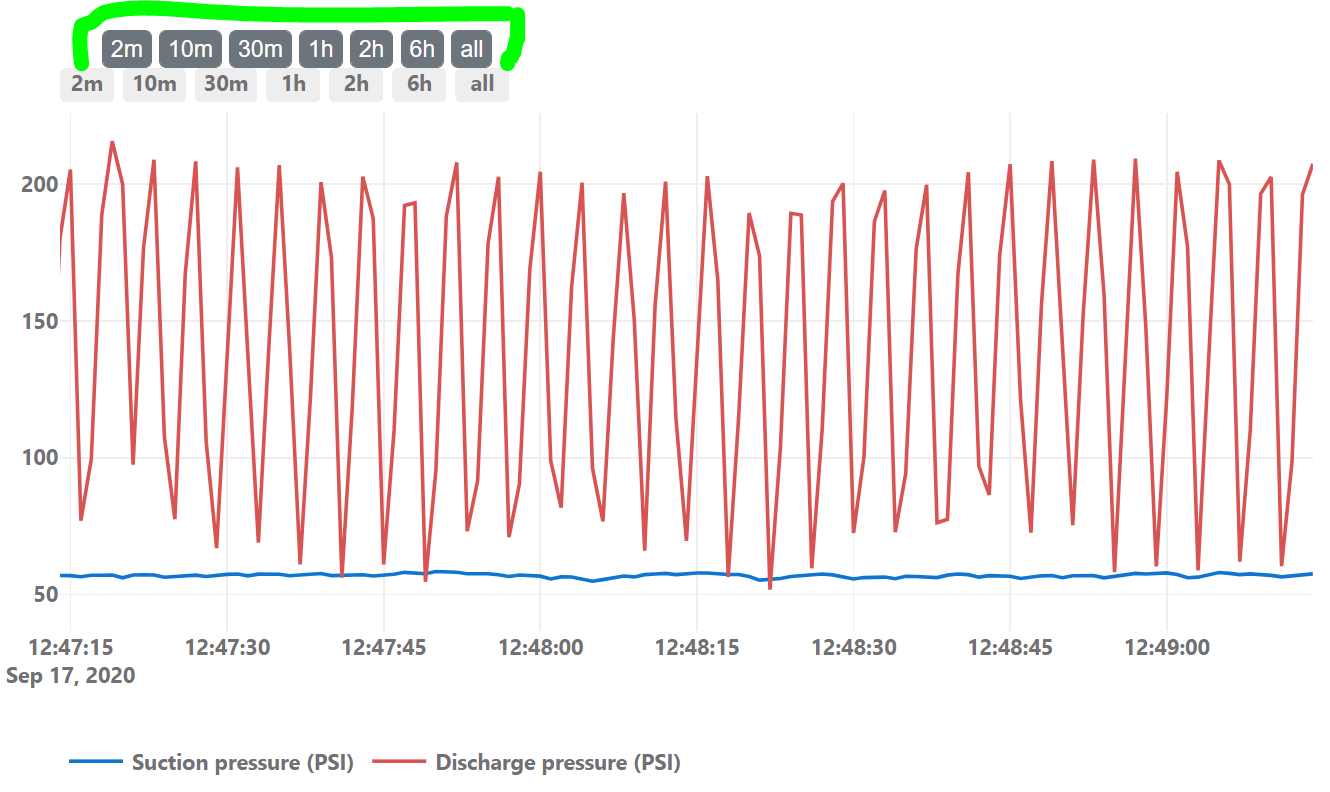
Here’s the layout to make the similar-looking buttons:


def get_graph_in_div(is_rt, graph_id):

    cn = "mr-1 mb-1 py-0 px-1"
    st = {"font-size": "0.8em"}
    cl = "secondary"

    div_body = []

    # A place to put a message, such as "no data available for this unit"
    div_body.append(html.Div(id=f"{graph_id}_msg"))

    # For the real time chart, make a custom set of rangeselector buttons
    # since the chart is constantly refreshing and not remembering the selected range
    if is_rt:
        div_body.append(
            html.Div(
                [
                    dcc.Store(id="store_rt_rangeselector", storage_type="session"),
                    dbc.Button(
                        "1m",
                        id="rt_rng_btn_1",
                        color=cl,
                        className=cn + " offset-1",
                        style=st,
                    ),
                    dbc.Button(
                        "2m", id="rt_rng_btn_2", color=cl, className=cn, style=st
                    ),
                    dbc.Button(
                        "5m", id="rt_rng_btn_3", color=cl, className=cn, style=st
                    ),
                    dbc.Button(
                        "10m", id="rt_rng_btn_4", color=cl, className=cn, style=st
                    ),
                    dbc.Button(
                        "20m", id="rt_rng_btn_5", color=cl, className=cn, style=st
                    ),
                    dbc.Button(
                        "1h", id="rt_rng_btn_6", color=cl, className=cn, style=st
                    ),
                    dbc.Button(
                        "all", id="rt_rng_btn_7", color=cl, className=cn, style=st
                    ),
                ],
                className="player text-left",
                id=f"{graph_id}_rangeselector_buttons",
            )
        )

    # Now add the actual graph, whose figure will be updated with a callback
    div_body.append(
        dcc.Graph(
            id=graph_id,
            # Disable the ModeBar with the Plotly logo and other buttons
            config=dict(
                displayModeBar=False,
            ),
            style={"display": "none"},
        ),
    )

    return html.Div(div_body)

and here are the callbacks:


    @dash_app.callback(
        Output("store_rt_rangeselector", "data"),
        [
            Input("rt_rng_btn_1", "n_clicks"),
            Input("rt_rng_btn_2", "n_clicks"),
            Input("rt_rng_btn_3", "n_clicks"),
            Input("rt_rng_btn_4", "n_clicks"),
            Input("rt_rng_btn_5", "n_clicks"),
            Input("rt_rng_btn_6", "n_clicks"),
            Input("rt_rng_btn_7", "n_clicks"),
        ],
    )
    def store_rt_rangeselector_value(_1, _2, _3, _4, _5, _6, _7):
        """Store which real time chart rangeselector button has been clicked"""

        # Find which id in the inputs has been triggered
        ctx = dash.callback_context
        if ctx.triggered:
            id_triggered = ctx.triggered[0]["prop_id"].split(".")[0]
        else:
            raise dash.exceptions.PreventUpdate

        data = {}
        if id_triggered == "rt_rng_btn_1":
            data = {"time_delta": "1 minutes"}
        elif id_triggered == "rt_rng_btn_2":
            data = {"time_delta": "2 minutes"}
        elif id_triggered == "rt_rng_btn_3":
            data = {"time_delta": "5 minutes"}
        elif id_triggered == "rt_rng_btn_4":
            data = {"time_delta": "10 minutes"}
        elif id_triggered == "rt_rng_btn_5":
            data = {"time_delta": "20 minutes"}
        elif id_triggered == "rt_rng_btn_6":
            data = {"time_delta": "1 hour"}
        elif id_triggered == "rt_rng_btn_7":
            data = {"time_delta": "all"}
        else:
            raise dash.exceptions.PreventUpdate

        return data

Then you can convert the Input("store_rt_rangeselector", "data") to a timedelta and use it to filter your charts (e.g. x_axis_start = x_axis_end - pd.Timedelta(time_delta) or something like that.

Cheers,
Sean

Hi Sean,

Thank you very much!
That was wonderful and fits all my needs.
I’ll try that immediately.

Cheers,
Wander