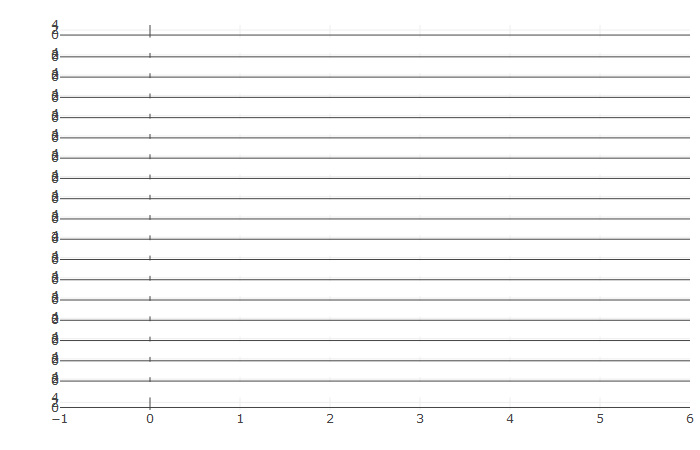
I tried to create a subplot with big numbers. A simplified example: the following code which creates 19 empty plots works fine.
plotList ← function(nplots) {lapply(seq_len(nplots), function(x) plot_ly())}
subplot(plotList(19), nrows = 19, shareX = TRUE, shareY = TRUE)
However, it goes wrong if the number of plots exceeds 20.
subplot(plotList(21), nrows = 21, shareX = TRUE, shareY = TRUE)

Is there a way to solve it?