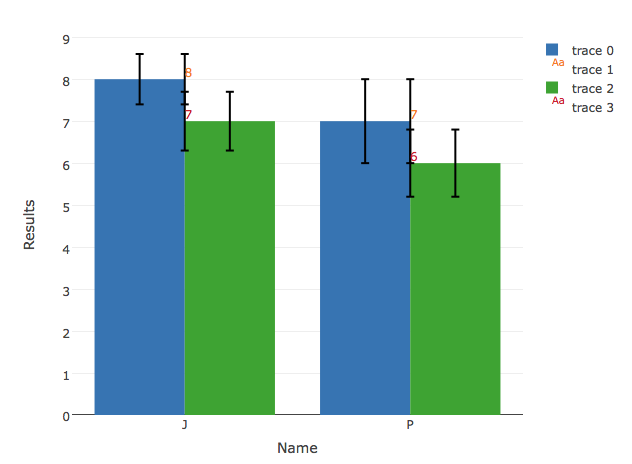
I create in R with plot_ly a bar plot. I want the bars to have a text (displaying their value) and with an error bar (from the same data frame). All gets well introduced, but the error bar duplicate. In this environment:
SampleData <- data.frame(Year = c(2014, 2014, 2015, 2015), Name = c("P", "J", "P", "J"),
    Results = c(7, 8, 6, 7), Error = c(1, 0.6, 0.8, 0.7))
SampleData <- split(SampleData, SampleData$Year)
I make the plot of 2014, with the error bar and the Results as text:
SamplePlot <- plot_ly(SampleData[[1]], x = ~Name, y = ~Results, type = "bar",
   text = ~Results, error_y = list(type = "data", array = ~Error, color = "black")) %>%
add_text(textposition = "top right")

I then try to add a trace to plot_ly, with the same format and error bar:
SamplePlot <- add_trace(SamplePlot, data = SampleData[[2]], y = ~Results, type = "bar",
    text = ~Results, error_y = list(type = "data", array = ~Error, color = "black")) %>%
add_text(textposition = "top right")
This plot will have well-placed error bars, but also other between the result bars:

Is there a way to do the add_trace with error_y and add_text, but without duplicating those error bars?
Thank you!