Hello
I’m using dash draggable, but as per the github issue, I can’t use it for pattern-matching-callback.
dash draggable issue
Do you know of any good remedies?
Hello @Osako,
You could use css to achieve this outcome.
Also, could. you please provide an example of the callback you are running into the issue? I see that issue has just the code to make the draggable elements.
Thank you for the reply
This is example(AnnMarieW’s reply)
example
That example doesn’t use draggable.
Please provide an MRE:
Sorry
Here is the code.
I am unable to resize the draggable by the number of columns.
There is also a github issue with the same issue.
import dash
from dash.dependencies import Input, Output, State, ALL, MATCH
import dash_html_components as html
import dash_core_components as dcc
import plotly.express as px
import json
import dash_draggable

df = px.data.gapminder()

app = dash.Dash(__name__)

app.layout = html.Div(
    [
        html.Div(
            children=[
                dcc.Dropdown(
                    options=[{"label": i, "value": i} for i in df.country.unique()],
                    value="Canada",
                    id="country",
                    style={"display": "inline-block", "width": 200},
                ),
                html.Button(
                    "Add Chart",
                    id="add-chart",
                    n_clicks=0,
                    style={"display": "inline-block"},
                ),
            ],
        ),
        html.Div(children=[dash_draggable.GridLayout (id ="draggable",
                                                       children=[])]),
    ]  ,
)


def create_figure(column_x, column_y, country):
    chart_type = px.line if column_x == "year" else px.scatter
    return (
        chart_type(df.query("country == '{}'".format(country)), x=column_x, y=column_y,)
        .update_layout(
            title="{} {} vs {}".format(country, column_x, column_y),
            margin_l=10,
            margin_r=0,
            margin_b=30,
        )
        .update_xaxes(title_text="")
        .update_yaxes(title_text="")
    )


@app.callback(
    Output("draggable", "children"),
    [
        Input("add-chart", "n_clicks"),
        Input({"type": "dynamic-delete", "index": ALL}, "n_clicks"),
    ],
    [State("draggable", "children"), State("country", "value")],
)
def display_dropdowns(n_clicks, _, children, country):
    default_column_x = "year"
    default_column_y = "gdpPercap"

    input_id = dash.callback_context.triggered[0]["prop_id"].split(".")[0]
    if "index" in input_id:
        delete_chart = json.loads(input_id)["index"]
        children = [
            chart
            for chart in children
            if "'index': " + str(delete_chart) not in str(chart)
        ]
    else:
        new_element = html.Div(
            style={
                "width": "23%",
                "display": "inline-block",
                "outline": "thin lightgrey solid",
                "padding": 10,
            },
            children=[
                html.Button(
                    "X",
                    id={"type": "dynamic-delete", "index": n_clicks},
                    n_clicks=0,
                    style={"display": "block"},
                ),
                dcc.Graph(
                    id={"type": "dynamic-output", "index": n_clicks},
                    style={"height": 300},
                    figure=create_figure(default_column_x, default_column_y, country),
                ),
                dcc.Dropdown(
                    id={"type": "dynamic-dropdown-x", "index": n_clicks},
                    options=[{"label": i, "value": i} for i in df.columns],
                    value=default_column_x,
                ),
                dcc.Dropdown(
                    id={"type": "dynamic-dropdown-y", "index": n_clicks},
                    options=[{"label": i, "value": i} for i in df.columns],
                    value=default_column_y,
                ),
            ],
        )
        children.append(new_element)
    return children


@app.callback(
    Output({"type": "dynamic-output", "index": MATCH}, "figure"),
    [
        Input({"type": "dynamic-dropdown-x", "index": MATCH}, "value"),
        Input({"type": "dynamic-dropdown-y", "index": MATCH}, "value"),
        Input("country", "value"),
    ],
)
def display_output(column_x, column_y, country):
    return create_figure(column_x, column_y, country)


if __name__ == "__main__":
    app.run_server(debug=True)
Hmm, mine seems to work.
Make sure you’ve updated dash, the version is now up to 2.6.2.
Here is the slightly modified code for 2.6.2.
import dash
from dash import Input, Output, State, ALL, MATCH, dcc, html
import plotly.express as px
import json
import dash_draggable

df = px.data.gapminder()

app = dash.Dash(__name__)

app.layout = html.Div(
    [
        html.Div(
            children=[
                dcc.Dropdown(
                    options=[{"label": i, "value": i} for i in df.country.unique()],
                    value="Canada",
                    id="country",
                    style={"display": "inline-block", "width": 200},
                ),
                html.Button(
                    "Add Chart",
                    id="add-chart",
                    n_clicks=0,
                    style={"display": "inline-block"},
                ),
            ],
        ),
        html.Div(children=[dash_draggable.GridLayout (id ="draggable",
                                                       children=[])]),
    ]  ,
)


def create_figure(column_x, column_y, country):
    chart_type = px.line if column_x == "year" else px.scatter
    return (
        chart_type(df.query("country == '{}'".format(country)), x=column_x, y=column_y,)
        .update_layout(
            title="{} {} vs {}".format(country, column_x, column_y),
            margin_l=10,
            margin_r=0,
            margin_b=30,
        )
        .update_xaxes(title_text="")
        .update_yaxes(title_text="")
    )


@app.callback(
    Output("draggable", "children"),
    [
        Input("add-chart", "n_clicks"),
        Input({"type": "dynamic-delete", "index": ALL}, "n_clicks"),
    ],
    [State("draggable", "children"), State("country", "value")],
)
def display_dropdowns(n_clicks, _, children, country):
    default_column_x = "year"
    default_column_y = "gdpPercap"

    input_id = dash.callback_context.triggered[0]["prop_id"].split(".")[0]
    if "index" in input_id:
        delete_chart = json.loads(input_id)["index"]
        children = [
            chart
            for chart in children
            if "'index': " + str(delete_chart) not in str(chart)
        ]
    else:
        new_element = html.Div(
            style={
                "width": "23%",
                "display": "inline-block",
                "outline": "thin lightgrey solid",
                "padding": 10,
            },
            children=[
                html.Button(
                    "X",
                    id={"type": "dynamic-delete", "index": n_clicks},
                    n_clicks=0,
                    style={"display": "block"},
                ),
                dcc.Graph(
                    id={"type": "dynamic-output", "index": n_clicks},
                    style={"height": 300},
                    figure=create_figure(default_column_x, default_column_y, country),
                ),
                dcc.Dropdown(
                    id={"type": "dynamic-dropdown-x", "index": n_clicks},
                    options=[{"label": i, "value": i} for i in df.columns],
                    value=default_column_x,
                ),
                dcc.Dropdown(
                    id={"type": "dynamic-dropdown-y", "index": n_clicks},
                    options=[{"label": i, "value": i} for i in df.columns],
                    value=default_column_y,
                ),
            ],
        )
        children.append(new_element)
    return children


@app.callback(
    Output({"type": "dynamic-output", "index": MATCH}, "figure"),
    [
        Input({"type": "dynamic-dropdown-x", "index": MATCH}, "value"),
        Input({"type": "dynamic-dropdown-y", "index": MATCH}, "value"),
        Input("country", "value"),
    ],
)
def display_output(column_x, column_y, country):
    return create_figure(column_x, column_y, country)


if __name__ == "__main__":
    app.run_server(debug=True)
Sorry for my poor explanation.
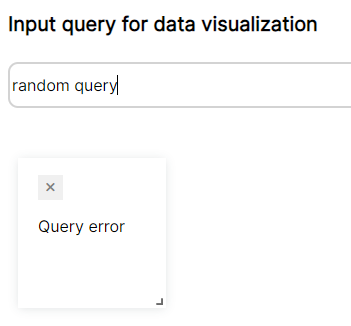
The code works, but the chart is very small when I press the add chart button. Changing nrow or ncol doesn’t make it bigger.
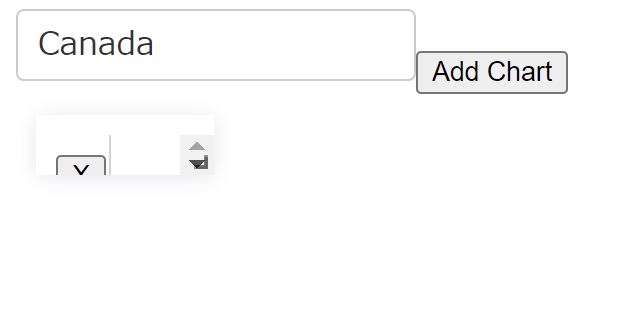
I think this is because the dict type id cannot be read.
The draggable div style is being automatically defined as this:
transform: translate(10px, 10px); width: 89px; height: 30px; position: absolute;
No changes I made even to the id fixed the issue that you are encountering. Dont know why it is defaulting to this. Also, remove your width argument from the div, its making the chart not take up the full width when expanded.
Thank you for your reply. I give up on using dash draggable and try what is in this [article].(Drag and drop cards - #2 by RenaudLN)
Nice, I do something similar using Js not react and mine won’t snap to a grid.
Let me know if you have issues with the pattern matching for the clientside callback.
Drag could! !
But there is a problem.
I have created a draggable button with a checkbox. But I can’t control the drag. (If I remove the check button again, it always drags.) I think something is wrong in the js file.
scripts.js
if (!window.dash_clientside) {
    window.dash_clientside = {};
}
window.dash_clientside.clientside = {
    make_draggable: function(id,value) {
        console.log(value)
        if (value =='draggable'){
            setTimeout(function() {
                var el = document.getElementById(id)
                window.console.log(el)
                dragula([el])
            }, 1)}
        return window.dash_clientside.no_update
    }
}
dragula.css
.gu-mirror {
    position: fixed !important;
    margin: 0 !important;
    z-index: 9999 !important;
    opacity: 0.8;
    -ms-filter: "progid:DXImageTransform.Microsoft.Alpha(Opacity=80)";
    filter: alpha(opacity=80);
  }
  .gu-hide {
    display: none !important;
  }
  .gu-unselectable {
    -webkit-user-select: none !important;
    -moz-user-select: none !important;
    -ms-user-select: none !important;
    user-select: none !important;
  }
  .gu-transit {
    opacity: 0.2;
    -ms-filter: "progid:DXImageTransform.Microsoft.Alpha(Opacity=20)";
    filter: alpha(opacity=20);
  }
app.py
import dash
from dash.dependencies import Input, Output, State, ALL, MATCH,ClientsideFunction
import dash_html_components as html
import dash_core_components as dcc
import plotly.express as px
import json
import dash_bootstrap_components as dbc
df = px.data.gapminder()

app = dash.Dash(
    __name__,
    external_scripts=["https://cdnjs.cloudflare.com/ajax/libs/dragula/3.7.2/dragula.min.js"],
    external_stylesheets=[dbc.themes.BOOTSTRAP]
)

app.layout = html.Div(
    [
        html.Div(
            children=[
                dcc.Dropdown(
                    options=[{"label": i, "value": i} for i in df.country.unique()],
                    value="Canada",
                    id="country",
                    style={"display": "inline-block", "width": 200},
                ),
                html.Button(
                    "Add Chart",
                    id="add-chart",
                    n_clicks=0,
                    style={"display": "inline-block"},
                ),
                dcc.Checklist (
                    id = "checklist",
                    options = [
                        {"label":"draggable","value":"draggable"}]),
            ]
        ),
        html.Div(id="container",className='con',children=[]),
    ]
)

#
def create_figure(column_x, column_y, country):
    chart_type = px.line if column_x == "year" else px.scatter
    return (
        chart_type(df.query("country == '{}'".format(country)), x=column_x, y=column_y,)
        .update_layout(
            title="{} {} vs {}".format(country, column_x, column_y),
            margin_l=10,
            margin_r=0,
            margin_b=30,
        )
        .update_xaxes(title_text="")
        .update_yaxes(title_text="")
    )


@app.callback(
    Output("container", "children"),
    [
        Input("add-chart", "n_clicks"),
        Input({"type": "dynamic-delete", "index": ALL}, "n_clicks"),
    ],
    [State("container", "children"), State("country", "value")],
)
def display_dropdowns(n_clicks, _, children, country):
    default_column_x = "year"
    default_column_y = "gdpPercap"

    input_id = dash.callback_context.triggered[0]["prop_id"].split(".")[0]
    if "index" in input_id:
        delete_chart = json.loads(input_id)["index"]
        children = [
            chart
            for chart in children
            if "'index': " + str(delete_chart) not in str(chart)
        ]
    else:
        new_element = html.Div(
            style={
                "width": "23%",
                "display": "inline-block",
                "outline": "thin lightgrey solid",
                "padding": 10,
            },
            children=[
                html.Button(
                    "X",
                    id={"type": "dynamic-delete", "index": n_clicks},
                    n_clicks=0,
                    style={"display": "block"},
                ),
                dcc.Graph(
                    id={"type": "dynamic-output", "index": n_clicks},
                    style={"height": 300},
                    figure=create_figure(default_column_x, default_column_y, country),
                ),
                dcc.Dropdown(
                    id={"type": "dynamic-dropdown-x", "index": n_clicks},
                    options=[{"label": i, "value": i} for i in df.columns],
                    value=default_column_x,
                ),
                dcc.Dropdown(
                    id={"type": "dynamic-dropdown-y", "index": n_clicks},
                    options=[{"label": i, "value": i} for i in df.columns],
                    value=default_column_y,
                ),
            ],
        )
        children.append(new_element)
    return children
#
#
@app.callback(
    Output({"type": "dynamic-output", "index": MATCH}, "figure"),
    [
        Input({"type": "dynamic-dropdown-x", "index": MATCH}, "value"),
        Input({"type": "dynamic-dropdown-y", "index": MATCH}, "value"),
        Input("country", "value"),
    ],
)
def display_output(column_x, column_y, country):
    return create_figure(column_x, column_y, country)

app.clientside_callback(
    ClientsideFunction(namespace="clientside", function_name="make_draggable"),
    Output("container", "data-drag"),
    [Input("container", "id"),
     Input("checklist","value")],
)


if __name__ == "__main__":
    app.run_server(debug=True)
Hi, I know this is an old thread, but I would like to provide a solution that I found to this problem of dash-draggable generating very small components. The issue seems to be that the default height of each component has been set to 30 pixels, and you need to dive into the dash_draggable.min.js file to change this value. For the ResponsiveGridLayout, this value can be found at the bottom of this file, as highlighted in the picture. In the picture, I have changed the value to 150, and now the newly generated components are no longer a thin strip. Do note that changing this value also changes the minimum dimensions of the component itself - i.e. by changing to value to 150, the minimum height becomes 150 pixels as well. It’s a bit of compromise in this sense. I believe the height value for GridLayout can be found just slightly north of the highlighted text - just search for the value “30”.
After that, I realised that this value also corresponds to “height” argument for ResponsiveGridLayout. This is a bit strange considering that the description for the “height” arugment is “height of the rows of the grid (in pixels).” and not the size of the added child components according to their documentation…
Either way, I hope that this will be useful to anyone trying to find a solution to this problem!